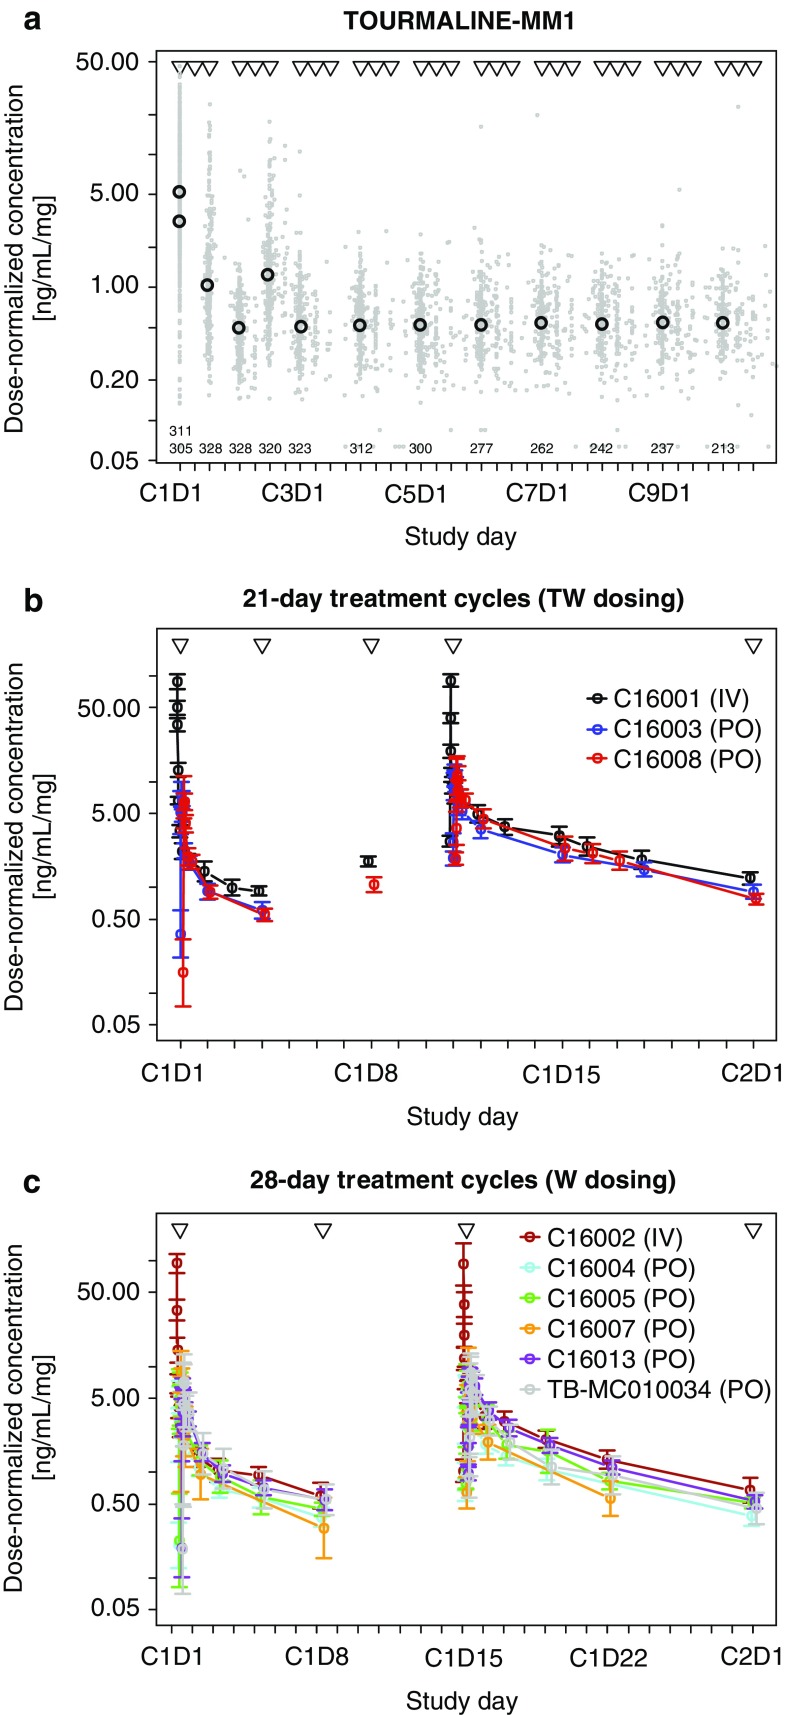
Fig. 1.
Geometric mean of dose-normalised ixazomib concentrations observed in: a TOURMALINE-MM1 binned by visit number (open black circles) with individual observations (grey dots) at the actual sampling times. Triangles indicate protocol-specified dose times and numbers indicate the number of PK samples included in each geometric mean calculation. b Cycle 1 in studies with 21-day treatment cycles (TW dosing) binned by protocol-specified sampling time. Triangles indicate protocol-specified dose times. Error bars show 95% CI of the geometric mean. c Cycle 1 in studies with 28-day treatment cycles (W dosing), binned by protocol-specified sampling time. Triangles indicate protocol-specified dose times. Error bars show 95% CI of the geometric mean. CI confidence interval, IV intravenous, PK pharmacokinetic, PO oral, TW twice weekly, W weekly

