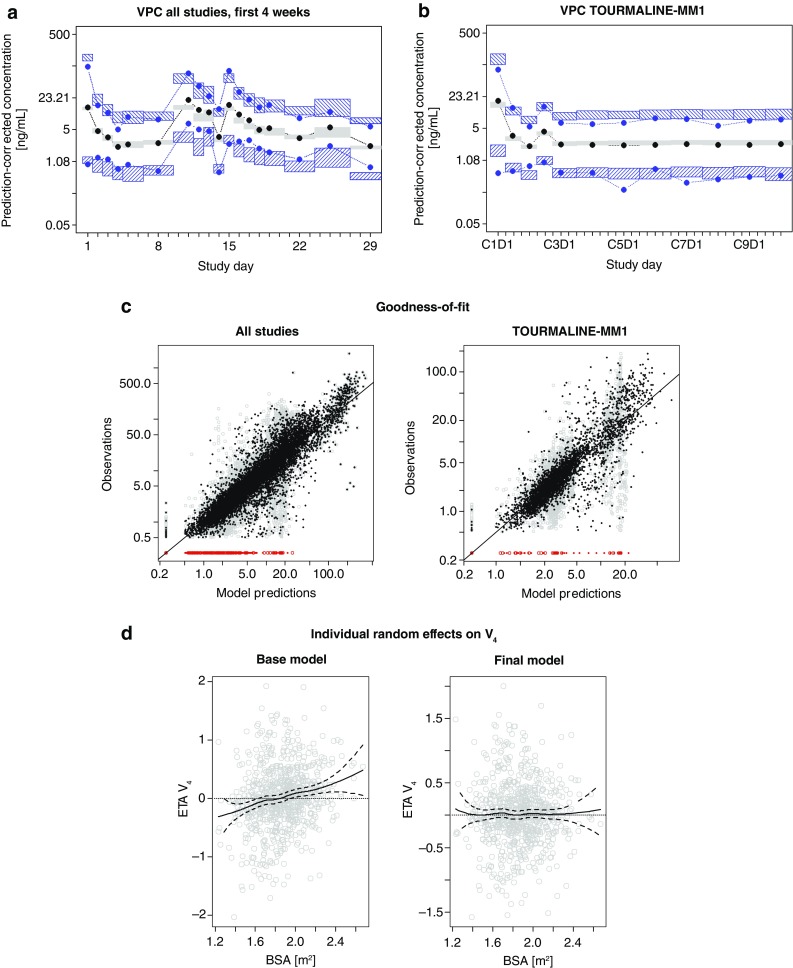
Fig. 3.

Diagnostic plots: a VPC showing data from the first 4 weeks of all studies based on 1000 simulated datasets. Median and 2.5th–97.5th percentile interval of prediction-corrected observed ixazomib concentrations (black and blue dots, respectively) model simulations (95% CI, grey and blue hatched areas). b VPC showing data from TOURMALINE-MM1 based on 1000 simulated datasets. Median and 2.5th–97.5th percentile interval of prediction-corrected observed ixazomib concentrations (black and blue dots, respectively) model simulations (95% CI, grey and blue hatched areas). c Goodness-of-fit of the final model based on data from all studies (left) and data from TOURMALINE-MM1 (right). Black and grey dots show observed data vs. individual and population predictions, respectively. Red dots indicate observed data below the limit of quantification and the solid line is the line of unity. d Individual random effects on V 4 based on the base model (left) and final model (right) shown vs. body surface area. Solid and dashed lines show a LOESS smooth curve with corresponding 95% CI. BSA body surface area, CI confidence interval, V 4 volume of distribution of second peripheral compartment, VPC visual predictive check
