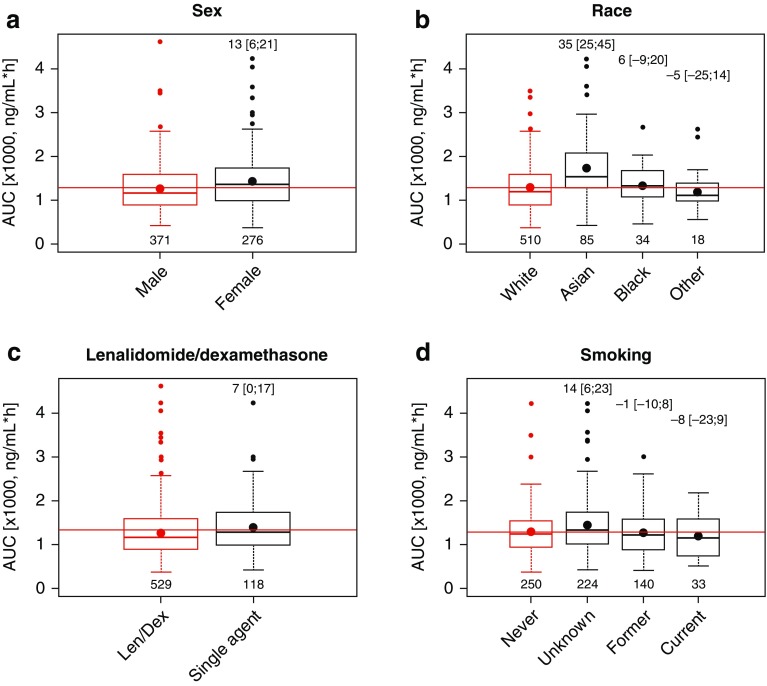
Fig. 5.
Individual predicted exposure stratified by key categorical patient covariates for patients receiving oral ixazomib. Red and black dots indicate the mean exposure in the most prevalent category and in other categories, respectively. Numbers (brackets) in the top of plots show the percent change in AUC∞ (with 95% CI) in other categories relative to the most prevalent category, while numbers at the bottom show patients in each category. AUC area under the concentration–time curve, CI confidence interval, len/dex lenalidomide/dexamethasone

