Figure 5.
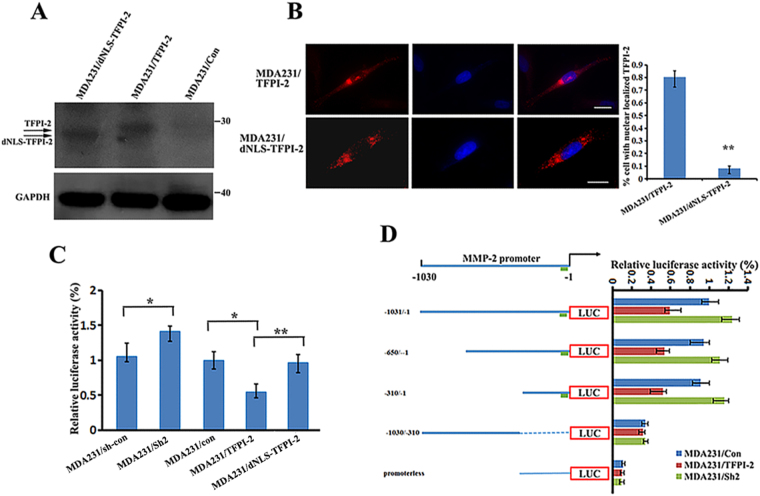
The active promoter region of the MPP-2 gene contains the binding site for AP-2α that interacts with TFPI-2. (A) Western blots show the expression of TFPI-2 and dNLS-TFPI-2 in MDA231 stable cell lines. GAPDH was used as a loading control. (B) Representative immunofluorescent assays indicate that deletion of the NLS blocked the nuclear localization of TFPI-2 in dNLS-TFPI-2 cell line. Scale bars: 10 μm. An average of 100 cells of each cell type was examined. **P < 0.01 as determined by Student’s t-test. (C) Analyses of the effect of nuclear localized TFPI-2 on MMP-2 promoter activity. Luciferase reporter driven by the -1030 to -1 bp of the MMP-2 promoter and an internal control Renilla luciferase plasmid were co-transfected into stable MDA231 cell lines. The firefly luciferase activity is normalized to the Renilla luciferase activity and the relative luciferase activity is represented. The results are the average of a total of three independent experiments each carried out in triplicate. *P < 0.05, **P < 0.01 as determined by Student’s t-test and by one-way ANOVA followed by Tukey’s multiple comparison tests. (D) Analyses of active regions of the MMP-2 promoter. Left: schematic representation of the luciferase reporter constructs driven by 5′ nested deletions of the MMP-2 promoter. Relative positions of the promoter region in each construct are marked. The arrow indicates the putative transcription initiation sites for the MMP-2 gene. The green block indicates the potential binding element for AP-2, SP1 and PEA3. Right: MMP-2 promoter constructs and an internal control Renilla luciferase plasmid were co-transfected into cultured MDA231/TFPI-2 cells. The firefly luciferase activity from each construct was normalized to the Renilla luciferase activity and the relative luciferase activity is represented as a percentage of the MMP-2 promoter construct (-1030/-1). The results are the average of three independent experiments each carried out in triplicate, ± SD. P < 0.01 as determined by one-way ANOVA followed by Tukey’s multiple comparison tests.

