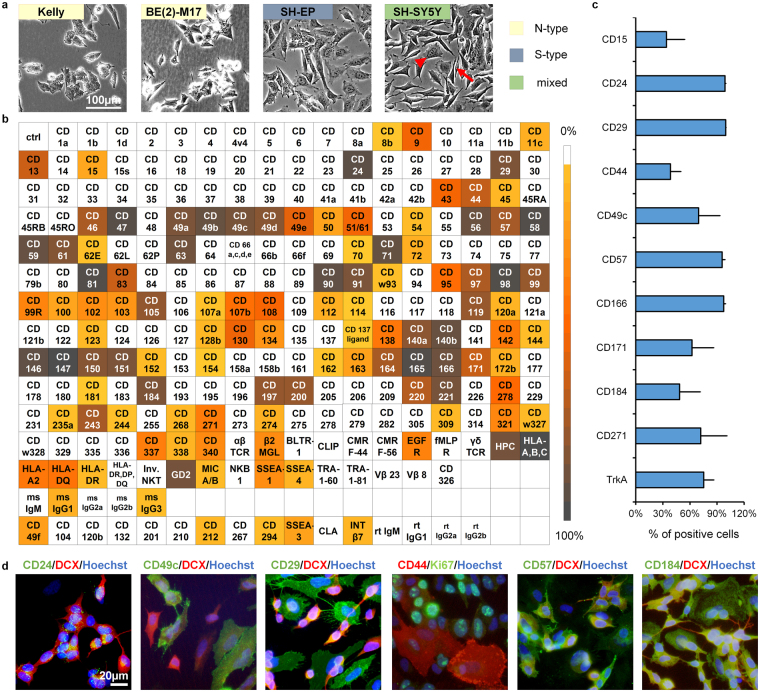
Figure 1.
SH-SY5Y cells as a model for the heterogeneity of NB. (a) Phase contrast images displaying the heterogeneity of NB cells within and across different cell lines as indicated (scale bar = 100 µm;  indicates an N-type,
  an S-type NB cell present in the SH-SY5Y cell line, right panel). (b) Flow cytometric screen of the expression levels of 242 surface molecules on SH-SY5Y cells. The heat map graph illustrates the percentage of positive cells for specific antigens within the overall live cell population (color scale; n = 1). Boxes shaded in white represent a ≤ 5% cut-off threshold value. CD: cluster of differentiation. (c) Expression of surface marker candidates selected for subsequent analysis under serum-free conditions (n ≥ 3; error bars represent standard deviation). (d) Immunofluorescence analysis confirming surface marker expression patterns and cellular heterogeneity of the SH-SY5Y NB line (scale bar = 20 µm).

