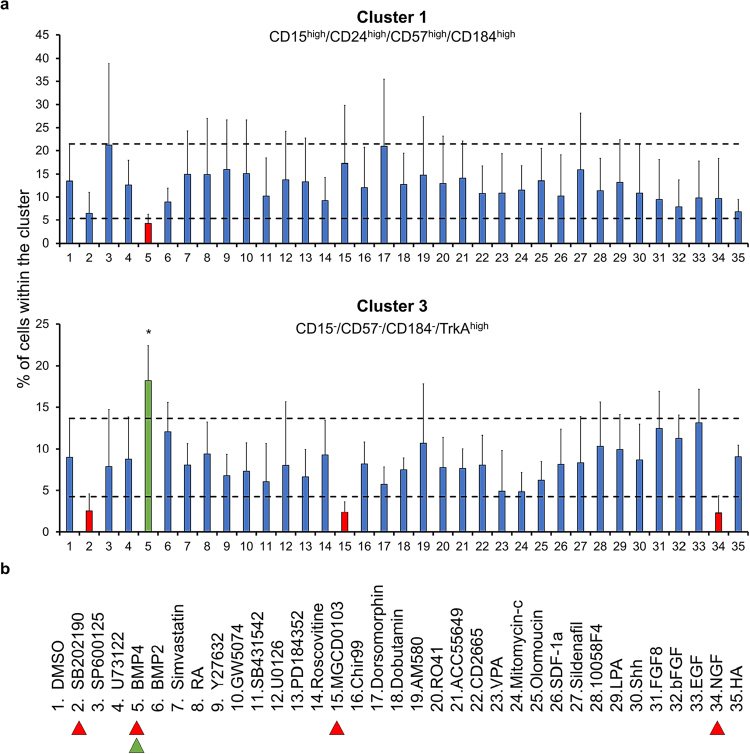
Figure 3.
Detecting distinctive responses of NB subpopulations to specific small molecule modulators. (a) Flow cytometry analysis of SPADE-defined NB subpopulation responsiveness to small molecule modulators following 48 hours of treatment (concentrations as indicated in Supplementary Table S2). In the small molecule screen conducted, four reagents revealed the capacity for enhancing or decreasing a specific subpopulation. Specifically, BMP4 was able to enhance neuronal differentiation whilst decreasing the amount of CD15high/CD24high/CD57high/CD184high cells (Cluster 1). Error bars represent standard deviation. Dashed lines represent 1 standard deviation from DMSO control. *p ≤ 0.05 in a one-way ANOVA test followed by Dunnett’s multiple comparisons test comparing all columns to the DMSO control. (b) List of small molecules applied in the screen. Colored arrowheads highlight  up-, or
  downregulation of subpopulations induced by the respective molecules (n ≥ 3).

