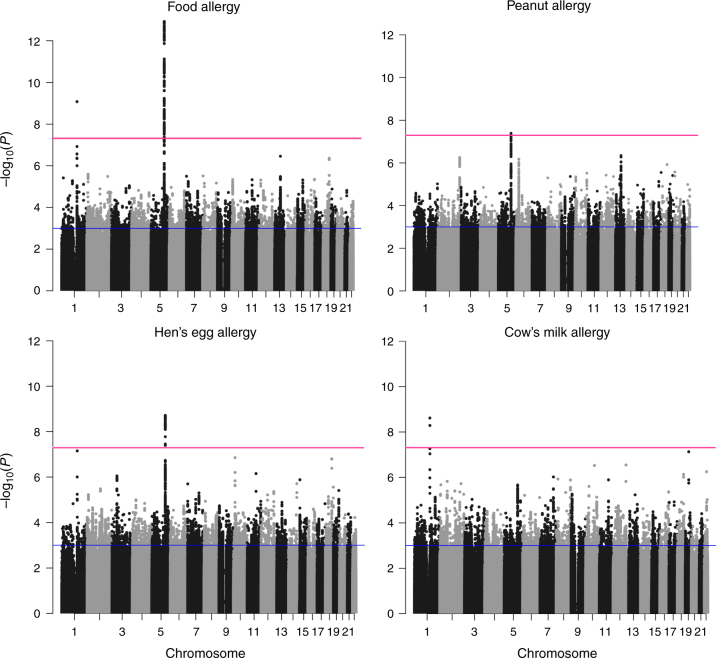
Fig. 2.
Association results of the GWAS on food allergy. The results of the GWAS on any food allergy (497 cases vs. 2387 controls) and on food-specific allergies against hen’s egg (288 cases), peanut (220 cases), and cow’s milk (169 cases) are presented. The Manhattan plots show the chromosomal positions (x-axis) and association P values (y-axis) for all SNPs of the discovery set. Red and blue lines indicate the thresholds for genome-wide significance (P < 5 × 10⁻⁸) and for entering the replication phase (P < 1 × 10⁻³) respectively

