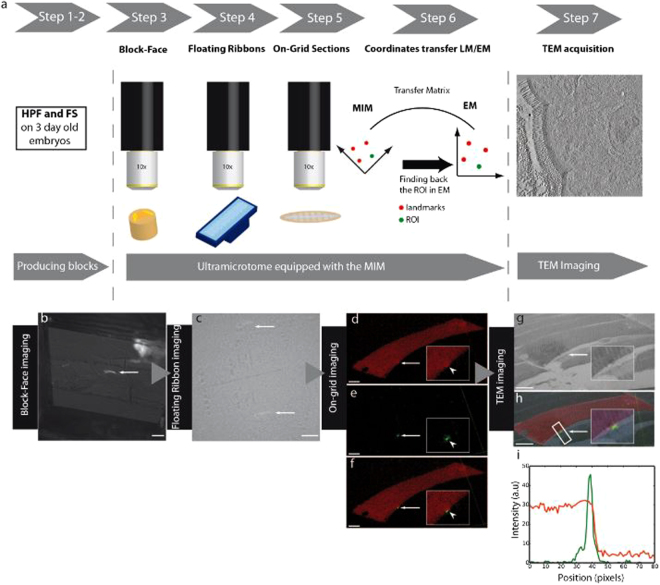
Figure 3.
Fluorescence tracking of membrane repair in zebrafish embryos using the MIM. (a) Workflow for fluorescence tracking of the ROI from sample cryofixation (HPF, step 1) and freeze-substitution (FS, step 2) to multi-step fluorescence tracking under the MIM including whole-embryo block-face imaging (step 3), fluorescence tracking on floating serial sections (step 4) and higher resolution « on-grid » imaging (step 5) and recording of coordinates of the ROI (step 6) followed by transmission electron microscopy (TEM) or tomography imaging (step 7). (b) Block-face fluorescence tracking of a single membrane injured myofiber (arrow) prior to trimming (10x objective). Scale bar, 100 µm. (c) Fluorescence tracking on floating serial sections immobilized with hair filaments on the boat of a Jumbo diamond knife (Diatome) acquired with the 10x objective (arrows). Scale bar, 100 µm. (d–f) Detailed fluorescence pictures of the cell of interest in 260 nm sections (40x objective) in pseudocolour after transfer to formvar-coated EM-slot-grid. Scale bar, 10 µm (5 µm in insets). The region pointed out by the arrow (arrow head in inset) of panel d corresponds to the lesion site. Note accumulation of Dysf-mCherry in the repair patch is not strongly visible due to the high gain in order to outline the entire myofiber. The lesioned region is recognizable in the red channel as a bump-like, local distortion of the cell boundary (see also higher magnification in the inset of panel (d). The green dot (e, arrow) corresponds to AnxA2-mEosFP accumulation in the repair patch. (f) Merged views of panels d and e show unequivocally that the chosen myofiber is the single myofiber in the embryo that has been damaged with the laser. (g) EM low magnification (450x) image of the same lesioned cell showing the position of the lesion superimposed in (h) with the fluorescence picture (arrow). Scale bar, 10 µm. The fluorescence intensity profile (i) across the myofiber (white rectangle (h)) highlights the localization of the green dot in the membrane.

