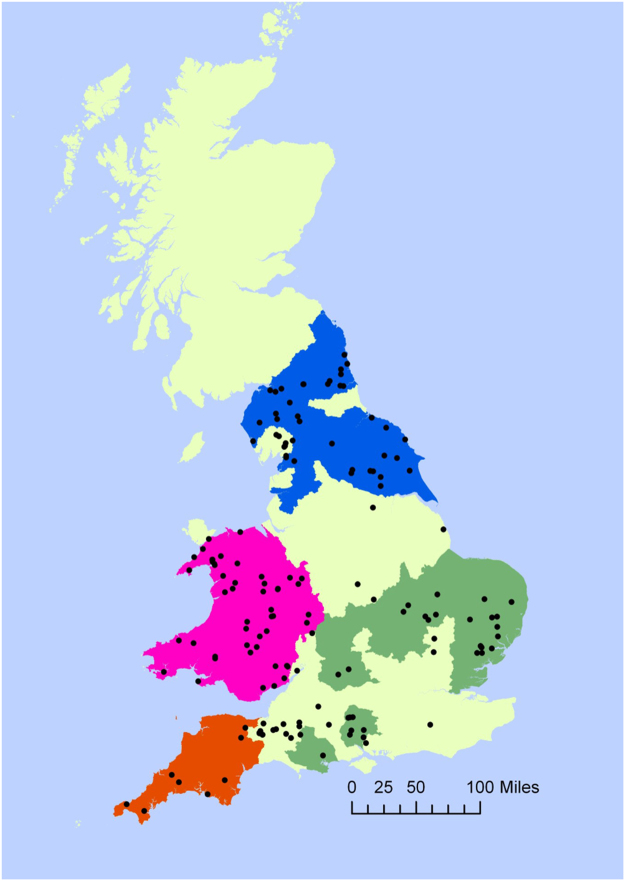
Figure 1.
Distribution of otter anal gland samples across four genetically distinct subpopulations in England and Wales. Pink = Wales and Borders (W&B), Red = South-west England (SW), blue = North England (NE), Green = Central England (CE). Samples outside the four subpopulations were excluded from the present analysis. Map created using ArcGIS® software ArcMap™ 10.1 Copyright © Esri www.esri.com. Outline of genetically distinct subpopulations created using data from Hobbs et al.27.

