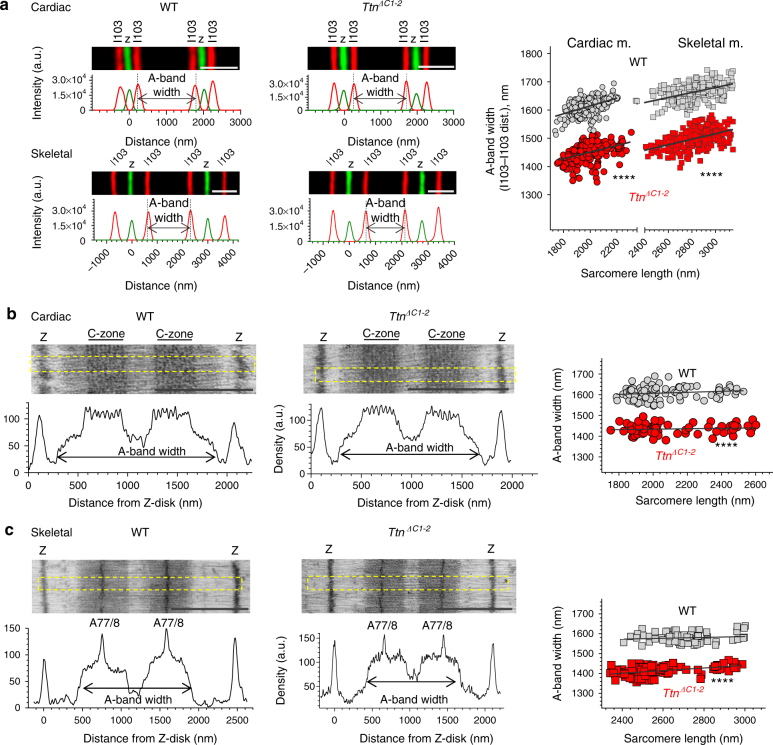
Fig. 2.
Effects of deleting C-zone repeats on A-band width. a Left, example of SIM images obtained using cardiac and skeletal muscle sections labeled with I103 titin antibody (A-band, red) and α-actinin (Z-disk, green). Right, summarized results of the A-band width measurements. In both muscle types the offsets of the linear regression lines are significantly lower in Ttn ΔC1-2 mice. b, c Left, representative IEM images of sarcomeres labeled with cMyBP-C (b) or A77/8 (c) with density profiles shown at bottom. Obtained summarized results are shown to the right. c The distance between A77/8 epitopes was measured and used to determine A-band shrinkage in skeletal muscle. Right, Shrinkage-corrected A-band width results. All linear regression fits show positive slopes but none are significantly different from zero. Line offsets are significantly reduced in Ttn ΔC1-2 mice. Statistical analysis is provided in Supplementary Table 4 (**** denotes p < 0.0001). Scale bars, 1 μm. The 8-week-old male mice were used (SIM: 10 WT and 9 Ttn ΔC1-2, IEM: 4 WT and 4 Ttn ΔC1-2)

