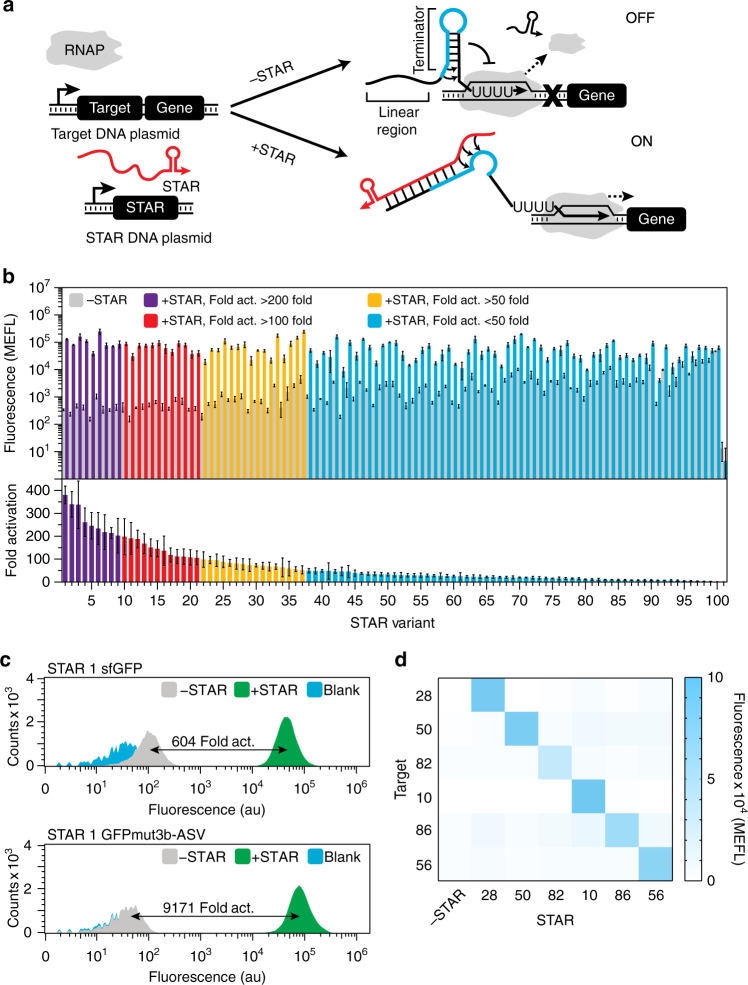
Fig. 1.
Characterization of a computationally designed STAR library. a Schematic of the Small Transcription Activating RNA (STAR) mechanism. A target DNA sequence is placed upstream of a gene, which is designed to fold into an intrinsic terminator hairpin, composed of a hairpin structure followed by a poly-uracil sequence. The formation of this terminator hairpin causes RNA polymerase (RNAP) to terminate transcription upstream of the gene (gene OFF). STARs (colored red) bind to both the linear region and the 5’ half of the terminator hairpin (colored blue) of the target RNA, preventing terminator formation and allowing transcription elongation of the gene (gene ON). b Characterization of 100 computationally designed STAR:target variants and the original AD1 STAR (variant 28)30. Fluorescence characterization was performed on E. coli cells transformed with a plasmid encoding each target RNA variant controlling superfolder GFP (sfGFP) expression in the absence (-STAR) and presence (+STAR) of a plasmid encoding its cognate STAR. Upper panel shows mean fluorescence and lower panel shows fold activation (ON/OFF), colored accordingly to the fold activation. A Welch’s t-test showed all variants had a statistically significant difference between -STAR and +STAR conditions (P < 0.05). c Flow cytometry histograms of a target RNA expressing sfGFP and GFPmut3b-ASV in the absence (−STAR) and presence (+STAR) of cognate STAR, compared to the autofluorescence of E. coli cells transformed with control plasmids (Blank). d Characterization of 6 STAR:target pairs predicted to be orthogonal (Supplementary Fig. 10) by challenging target RNAs controlling sfGFP expression against cognate and non-cognate STARs. Fluorescence characterization was performed as in b for each STAR:target combination. Cognate pairs are across the diagonal and the -STAR condition in the left column. Raw data shown in Supplementary Fig. 11. Data were measured with flow cytometry in units of arbitrary fluorescence (au, panel c) or Molecules of Equivalent Fluorescein (MEFL, panel b, d). Data in b, d represent mean values and error bars represent s.d. of at least n = 7 biological replicates, and c a representative flow cytometry histogram of n = 1 biological replicates with repeats shown in Supplementary Fig. 6

