Fig. 5.
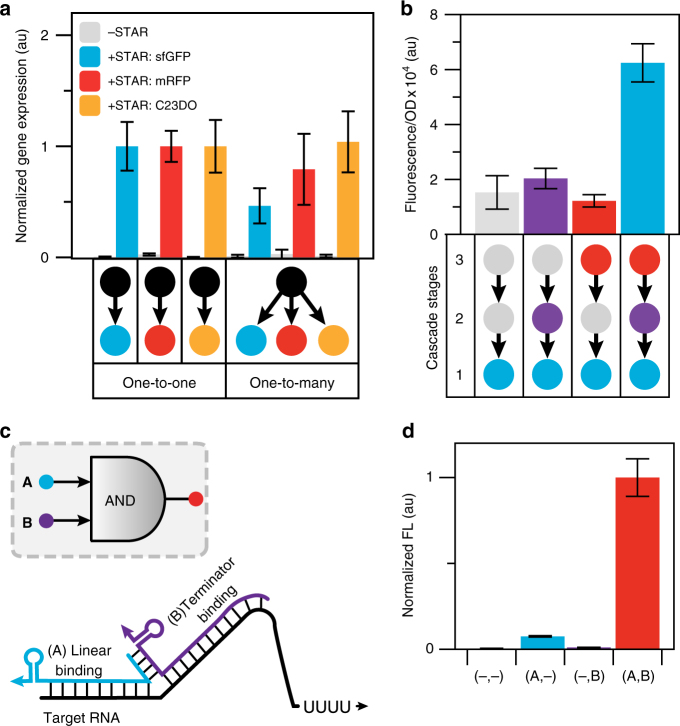
STARs allow for new RNA-only network motifs. a A STAR single-input module (SIM) for one-to-many gene regulation. Fluorescence and spectral characterization of E. coli cells transformed with DNA plasmids encoding target RNAs controlling sfGFP, mRFP or catechol (2,3)-dioxygenase (C23DO) expression in the absence (-STAR) and presence (+STAR) of a plasmid encoding the cognate STAR. One-to-one characterization was performed on three different cell strains transformed with one of the plasmids encoding a single STAR regulated gene with and without the STAR plasmid. One-to-many characterization was performed on a single strain transformed with two plasmids encoding all three STAR regulated genes simultaneously with and without the STAR plasmid. C23DO expression level was determined as described in Supplementary Fig. 18. Measurements for each gene were normalized to 1 for the one-to-one value for that gene. b An RNA-only STAR activation-activation cascade. Fluorescence characterization was performed on E. coli cells transformed with combinations of DNA plasmids encoding cascade stages or control constructs. Cascade stage combinations used are shown in the schematic below the graph with grey indicating the use of a control DNA plasmid (Supplementary Fig. 19). c Schematic of a split STAR AND gate. STAR 1 was split into two regions corresponding to the linear and the terminator hairpin binding regions of the STAR (referred to as A and B), with a designed interaction sequence to promote the assembly of the full STAR complex (AB) when both are present. d Fluorescence characterization was performed on E. coli cells transformed with a DNA plasmid encoding a target RNA controlling sfGFP expression in the presence of a DNA plasmid encoding different combinations of A and B. Measurements were normalized to 1 for the AB condition. a, b Fluorescence characterization was performed by bulk fluorescence measurements (measured in units of fluorescence [FL]/optical density [OD] at 600 nm) and a spectral characterization. Raw data for the a spectral characterization is shown in Supplementary Fig. 18. d Fluorescence characterization was performed by flow cytometry (measured in units of Molecules of Equivalent Fluorescein [MEFL]). Data represent mean values and error bars represent s.d. of n = 9 biological replicates

