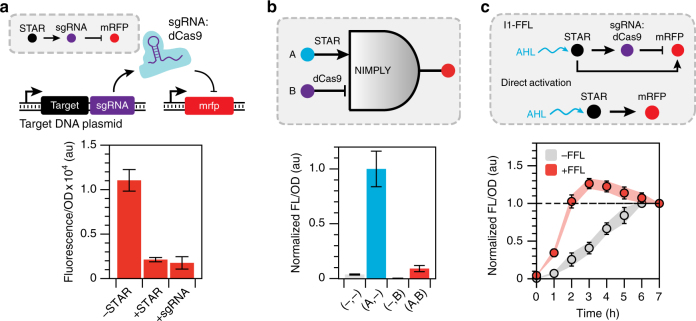
Fig. 6.
STARs and CRISPRi create new types of dynamic network motifs. a STARs function with CRISPRi in an RNA activation-repression cascade. Schematic of the DNA template of a STAR regulated CRISPRi cascade. Fluorescence characterization was performed on E. coli cells transformed with a dCas9 and target RNA-mRFP expressing plasmid and a STAR-regulated single guide RNA (sgRNA) plasmid in the absence (-STAR) and presence (+STAR) of a plasmid encoding the cognate STAR. A constitutively expressed sgRNA (+sgRNA) was used as a control. Detailed schematic and full experimental controls are shown in Supplementary Fig. 20. b STARs function with CRISPRi in logic gates. Schematic of a STAR and CRISPRi based NIMPLY (A AND NOT B) logic gate (see Supplementary Fig. 21 for a detailed schematic). Fluorescence characterization was performed on E. coli cells transformed with a plasmid encoding the NIMPLY logic gate and sgRNA in the presence of plasmids encoding all combinations of input A (STAR) and input B (dCas9). Fluorescence data were normalized to 1 for the ON condition (Input A only). c A STAR-CRISPRi incoherent type 1 feed-forward loop (I1-FFL) creates accelerated response and a pulse of gene expression. Schematic of the STAR-CRISPRi I1-FFL and direct activation control (see Supplementary Fig. 21 for a detailed schematic). Fluorescence characterization of E. coli cells transformed with a plasmid encoding the I1-FFL ( + FFL) or the direct activation (-FFL) cascade. STAR expression was induced at time 0 h by addition of AHL and fluorescence measured every 1 h for 7 h. No AHL controls are shown in Supplementary Fig. 22. Fluorescence data for each condition were individually normalized by dividing by the final fluorescence values at 7 h for each colony before calculating the mean and s.d. at each time point. Fluorescence characterization was performed by bulk fluorescence measurements (measured in units of fluorescence [FL]/optical density [OD] at 600 nm). Data in a, b represent mean values and error bars represent s.d of n = 9 biological replicates, and data in c represent mean values and error bars represent s.d of n = 3 biological replicates with repeats shown in Supplementary Fig. 22

