
Fig. 3.
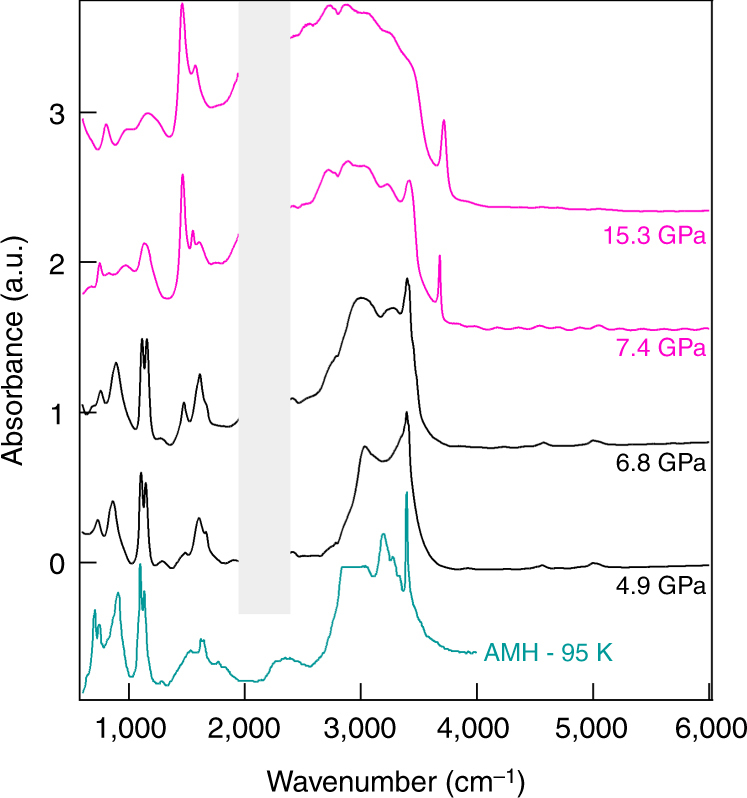
Evolution with pressure of the experimental IR absorption spectra of AMH. The spectra were collected upon decompression at RT. Pink and black curves are spectra collected above and below the ionic-molecular phase transition, respectively. The frequency window from 2000 to 2300 cm−1 is obscured by the strong absorption band of the diamond anvils. Pressures are indicated on the right. The blue curve is the experimental spectrum of the molecular AMH-I phase at ambient pressure and 95 K from ref. 35