Fig. 5.

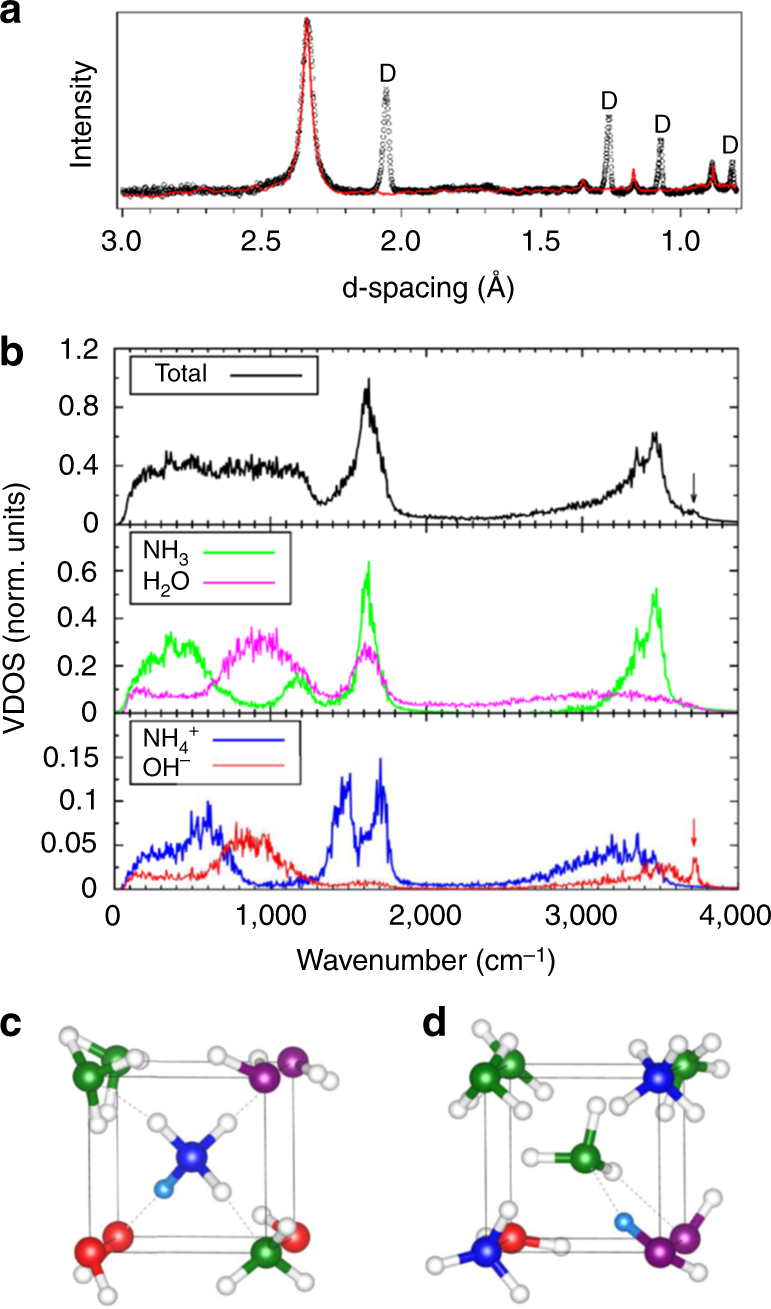
Structural and vibrational properties of the disordered ionico-molecular alloy. In a, we compare the simulated neutron pattern for the 6 × 6 × 6 simulation box (red line) to the experimental neutron pattern collected at 10 GPa, 295 K (symbols). The x scale of the simulated pattern has been multiplied by 0.994 to account for the density difference, and the intensity adjusted to scale with the main (110) peak. The Bragg peaks were modelled by pseudo-Voigt profiles of constant width. “D” indicates the reflections from the diamond anvils. b shows the vibrational density of states obtained from the AIMD trajectories. The arrows indicate the OH− stretching mode. c, d Represent simulation snapshots showing the nearest-neighbour environment of an ammonium ion (c) or an ammonia molecule (d). The H atom involved in the H-bond between the central ammonia and neighbour water molecule is rendered in cyan, the others are represented by white spheres. N atoms are in green and blue for NH3 and NH respectively, and O atoms are in magenta and red for H2O and OH−, respectively. The solid and dashed lines depict the cubic unit cell and the H bonds, respectively. For clarity, all species have been placed on their average sites
