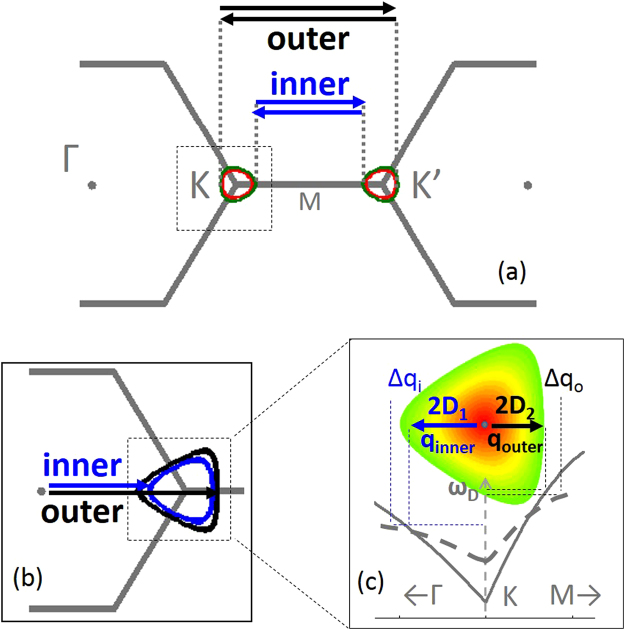
Figure 1.
Schematic of the double resonance mechanism. (a) Top view of the K and K’ electron dispersion iso-energy contours for the selected k vectors. Red and green circles in (a) are the iso-energy contours E L /2 and (E L /2 − hcω D) at K and K’, respectively for the red (633 nm) and green laser (532 nm) excitation wavelengths. The black and blue arrows show the resonant k-vectors for the outer and inner processes, respectively. These vectors pick out the phonon iso-energy contours shown in (b) and the phonon q vectors in (c) shown both in a top view (top) and a crosscut (bottom). If the phonon dispersion does not fully match the electronic dispersion, there will be an energy difference between the inner and outer phonon, here shown as the outer resonance having higher energy. The dashed line in the cross cut qualitatively depicts the change in phonon dispersion with increased screening. The Δq addition to the q vectors represents the added length with increased screening due to the change in Fermi velocity and therefor the electronic iso-energy contours.

