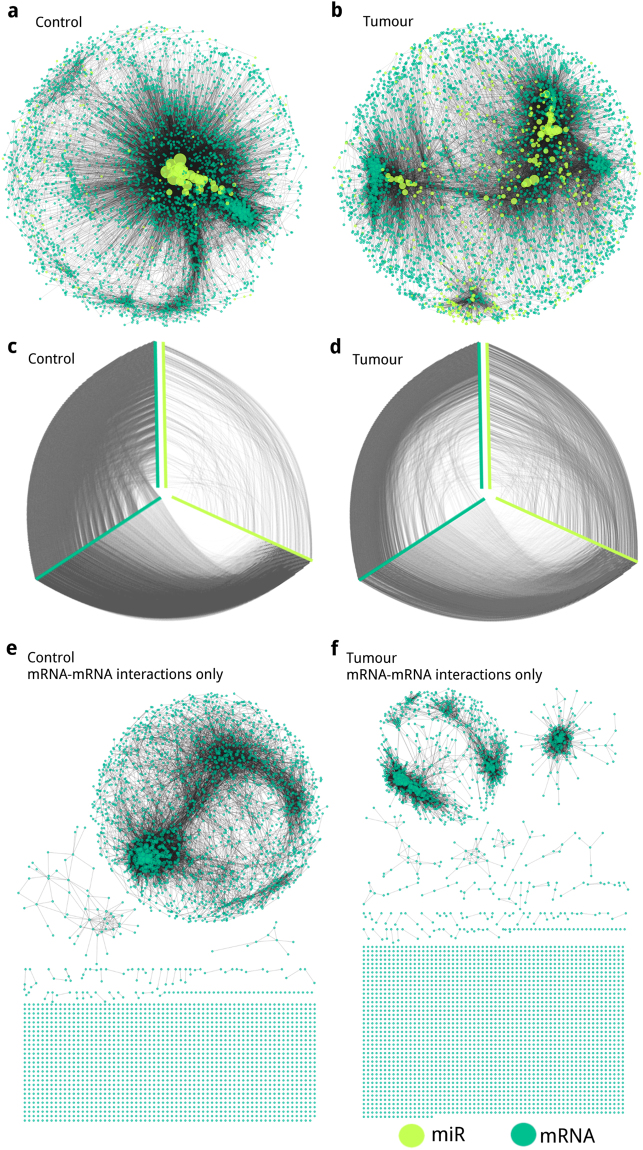
Figure 2.
Representation of Large component networks inferred from (a) control and (b) tumour data. Hiveplot representation of the networks inferred from (c) control, and (d) tumour data. Yellow-green nodes represent miRs, meanwhile turquoise nodes represent mRNAs. For (a) and (b) node size is proportional to node degree. For (c) and (d) hiveplot visualization: network nodes are represented in the axes ordered by increasing degree from its centre; edges between yellow-green axes represent miR-miR edges; between turquoise axes the mRNA-mRNA edges; and between yellow-green and turquoise axes the miR-mRNA ones. Effect on component disintegration after mRNA removal from the largest component of the networks inferred from (e) control and (f) tumour data.

