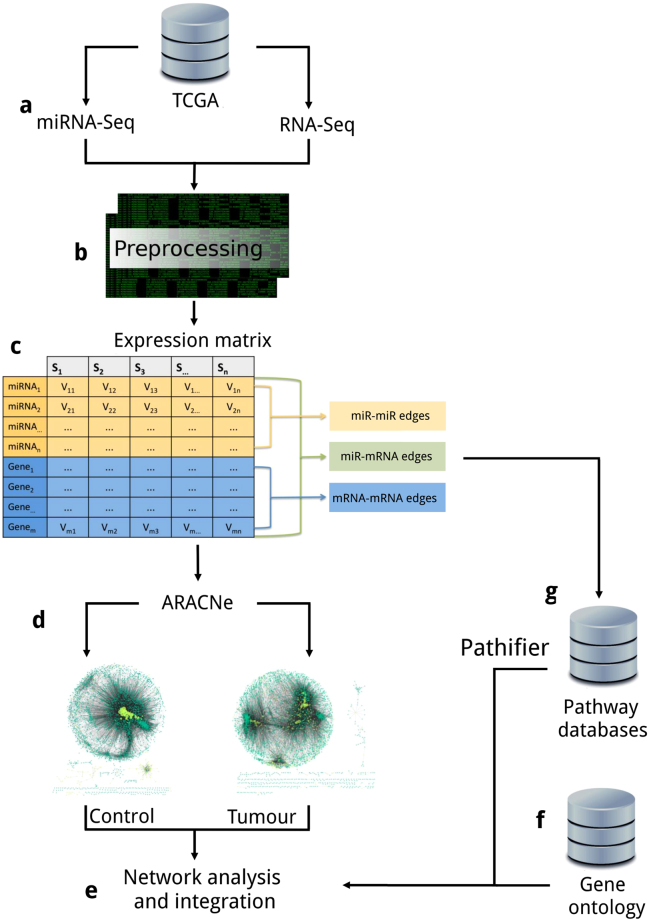
Figure 6.
Pipeline description. (a) Paired RNAseq and miRseq expression data from 86 patients were obtained from TCGA. (b) Data preprocessing and normalization. (c) Normalized expression matrix with miR and mRNA (rows) expression values for each sample (columns). (d) Network construction by the ARACNE algorithm with the expression matrix as input. (e) Network analysis and result integration. (f) Gene ontology enrichment analysis from resulting network nodes (mRNAs). (g) Pathifier analysis from resulting network nodes (mRNAs) with first neighbour associations with miR-200 and DLK1-DIO3 miRs.

