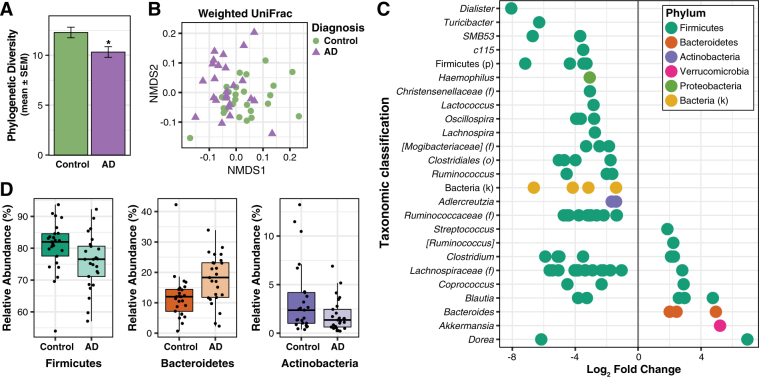
Figure 1.
Alzheimer’s disease is associated with alterations in gut microbiome composition. (A) Faith’s Phylogenetic Diversity is decreased in the microbiome of AD participants. *p < 0.05. (B) Non-metric multidimensional scaling (NMDS) plot of weighted UniFrac analysis of relative sample OTU composition. NMDS analysis was limited to two dimensions, with a stress measurement of 0.17. Each dot represents a scaled measure of the composition of a given participant, color- and shape-coded by cohort. (C) Differential abundance analysis identified 14 OTUs that were increased and 68 OTUs that were decreased in AD relative to Control participants (p < 0.05, FDR-corrected). Each point represents an OTU. Data plotted as log2 fold change; OTUs to the right of the zero line are more abundant and OTUs to the left of the zero line are less abundant in AD compared to Control groups. OTUs are organized on the y-axis according to the lowest taxonomic classification possible. (D) OTUs grouped at the phylum level and analyzed using Metastats show that AD participants have decreased abundance of Firmicutes and Actinobacteria, and increased abundance of Bacteroidetes compared to Control participants (p < 0.05, FDR-corrected). Tukey plots show median, IQR, and participant data points for phylum relative abundance.

