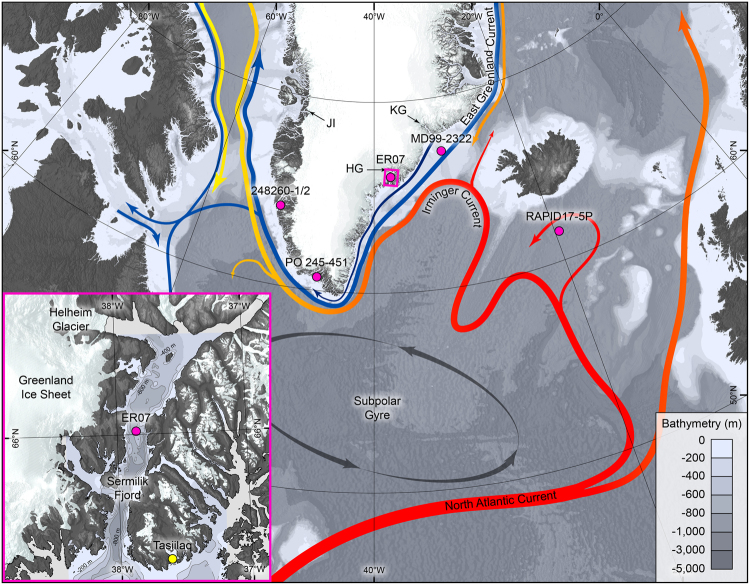
Figure 1.
Map of the North Atlantic region showing the major surface ocean currents13 (colour of arrows indicate temperature; red = warm, blue = cold, yellow = mixture) and location of sites referred to in Fig. 3a–f. HG = Helheim Glacier; KG = Kangerdlugssuaq Glacier; JI = Jakobshavn Isbræ. Magenta circles show location of sediment cores discussed in the text and shown on Figs 2 and 3. The magenta box delineates the extent of the inset map. Bathymetric data are from IBCAO v356. Terrestrial topographic data are from the ETOPO1 Global Relief model57 and the GIMP surface digital elevation model58. The inset map of Sermilik Fjord shows the location of sediment core ER07 and the local bathymetry59. The figure was created using ArcMap 10.1 (http://desktop.arcgis.com/en/arcmap/) and Adobe Illustrator CS6 ( http://www.adobe.com/products/illustrator.html).

