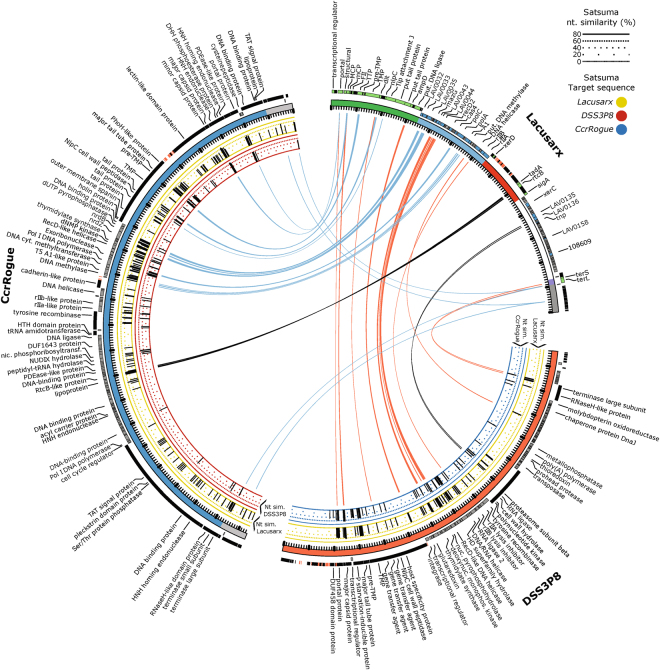
Figure 3.
Genome comparison of phages Lacusarx (multiple colors), DSS3Φ8 (red), and CcrRogue (blue). Genes on forward strand are marked as black blocks raised over reverse strand blocks in grey. Genes with putative functions assigned in Lacusarx are marked with green on forward strand and blue on reverse. Predicted tRNA genes in all three strains are marked with red. Functional modules in Lacusarx are shown with the same colors as Fig. 2. Links between genomes indicate TBLASTX with minimum 50% identity over minimum 50 amino acids with blue lines from Lacusarx to CcrRogue and red lines from Lacusarx to DSS3Φ8. Black lines indicate a TBLASTX from Lacusarx to the opposite strand on the target sequence. Histograms under DSS3Φ8 and CcrRogue show percentage nucleotide similarity, as determined with Satsuma, to Lacusarx (yellow background), CcrRogue (blue background) and DSS3Φ8 (red background).

