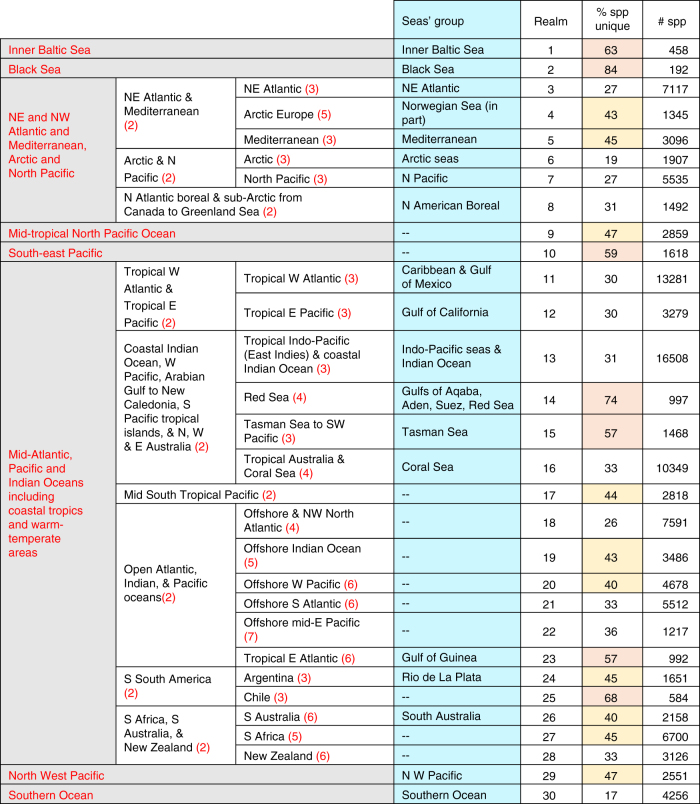
Fig. 1.
Classification hierarchy and number of species belonging to the mapped biogeographic realms. The classification hierarchy from this analysis is compared to the clustering of seas and oceans as shown on a blue background. The red text in column 1 denotes the realms defined by pelagic-only species and clustered at 1% similarity. The red numbers in parentheses in columns 2 and 3 indicate further similarity index levels, e.g., 3 = 3% similarity between 5o areas in that region. The percentage of unique species indicates how distinct the realm was from the others; cells with yellow background represent > 40%, while cells with peach colored background represent > 50%. Comparisons with previous studies are in Supplementary Table 7. E, east; N, north; S, south; Spp, species; W, west

