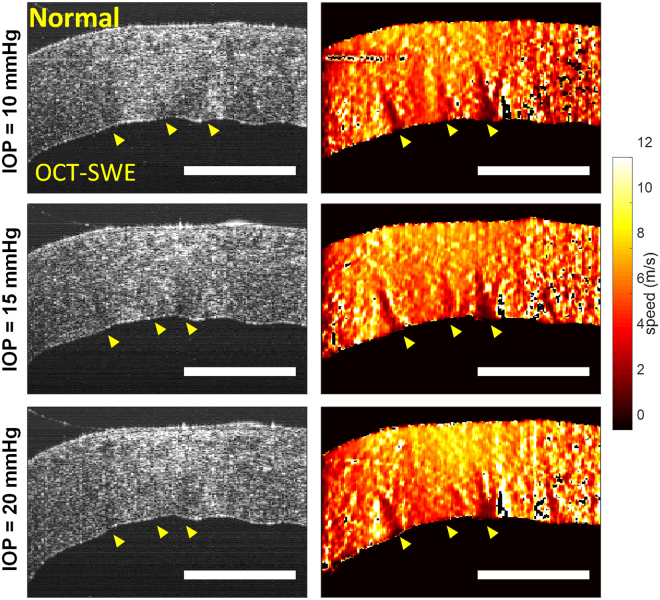
Figure 5.
Optical coherence tomography (OCT) and shear wave elastography (SWE) images (left and right columns respectively) of a macaque cornea mounted in an artificial anterior chamber at different values of intraocular pressure (IOP). As indicated by the arrowheads, 3 striae are visible on the elastic maps (color scale: lower speed = softer region), while they are less obvious on the morphologic OCT image (gray scale) except for the far left stripe. The global propagation speed of the shear wave, from the right to the left hand side of the image, increases slightly with IOP, while contrast on striae reduces (see also Fig. 6). The rigidity maps show zones of discontinuity at striae, where shear wave speed cannot be accurately calculated due to rebounds, however global speed in striae zones reduces, indicating that striae are softer than surrounding stroma. Scale bars show 1mm.

