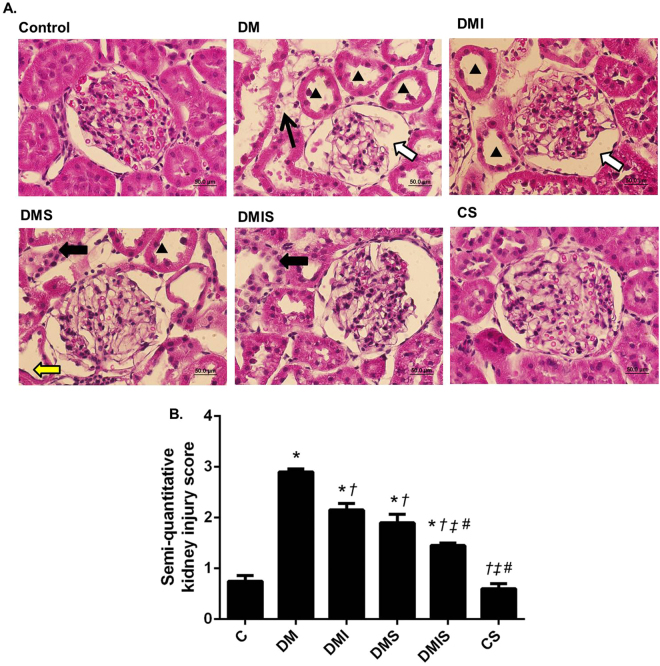
Figure 1.
(A) Photomicrographs of histological sections of kidney stained with hematoxylin and eosin (H&E) (x40); images of glomeruli and renal tubules from control, diabetic (DM), diabetic plus insulin (DMI), diabetic plus atorvastatin (DMS), diabetic and insulin plus atorvastatin (DMIS) groups, and control plus atorvastatin (CS) are indicated. (▲) Shows dilatation of renal tubular; (arrow) represents interstitial fibrosis; (white arrow) represents capsular space of the glomerular capsule; (black arrow) represents neutrophil accumulation; (yellow arrow) represents tubular atrophy. (B) Quantitative analysis of diabetic injury kidney was determined by semi-quantitative kidney injury scoring (0–4); Bar graphs presented show mean ± SEM. n = 5 rats per group. C - control group; DM - diabetic group; DMI - diabetic plus insulin group; DMIS - diabetic and insulin plus atorvastatin group; DMS - diabetic plus atorvastatin group; CS - control plus atorvastatin. *p < 0.05 vs. control group and control plus atorvastatin groups, †p < 0.05 vs. diabetic group, ‡p < 0.05 vs. diabetic plus insulin group, and #p < 0.05 vs. diabetic plus atorvastatin group.

