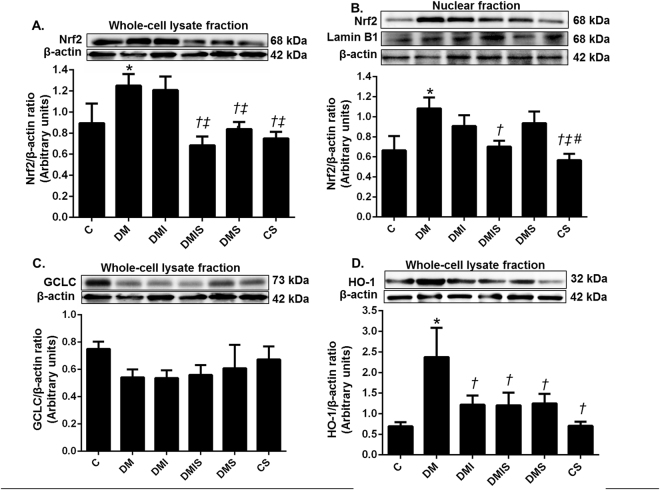
Figure 4.
Effects of pharmacological intervention on the renal cortical expression of Nrf-2, GCLC and HO-1. Western blot analysis of Nrf2 expression in nuclear (A), Nrf2 in whole cell lysate fractions (B), GCLC (C), and HO-1 (D) of renal cortical tissues (whole cell lysate fraction) (cropped blots) normalized to β-actin. Lamin B1 was used as a marker for the nuclear fraction. Full-length blots are presented in Supplementary Figure 3. Bar graphs presented show mean ± SEM. n = 6 rats per group. C - control group; DM - diabetic group; DMI - diabetic plus insulin group; DMIS - diabetic and insulin plus atorvastatin group; DMS - diabetic plus atorvastatin group; CS - control plus atorvastatin. *p < 0.05 vs. control group and control plus atorvastatin groups, †p < 0.05 vs. diabetic group, ‡p < 0.05 vs. diabetic plus insulin group, and #p < 0.05 vs. diabetic plus atorvastatin group.

