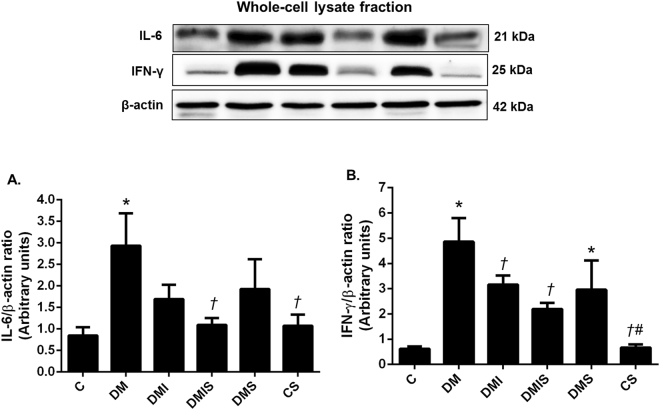
Figure 6.
Effects of pharmacological intervention on the expression of IL-6, and IFN-γ in pancreatic tissues. Western blot analysis showing the expression of IL-6 (A), and IFN-γ (B) in pancreatic tissues (cropped blots) normalized to β-actin. Full-length blots are presented in Supplementary Figure 5. Bar graphs presented show mean ± SEM. n = 6 rats per group. C - control group; DM - diabetic group; DMI - diabetic plus insulin group; DMIS - diabetic and insulin plus atorvastatin group; DMS - diabetic plus atorvastatin group; CS - control plus atorvastatin. *p < 0.05 vs. control group and control plus atorvastatin groups, †p < 0.05 vs. diabetic group, ‡p < 0.05 vs. diabetic plus insulin group, and #p < 0.05 vs. diabetic plus atorvastatin group.

