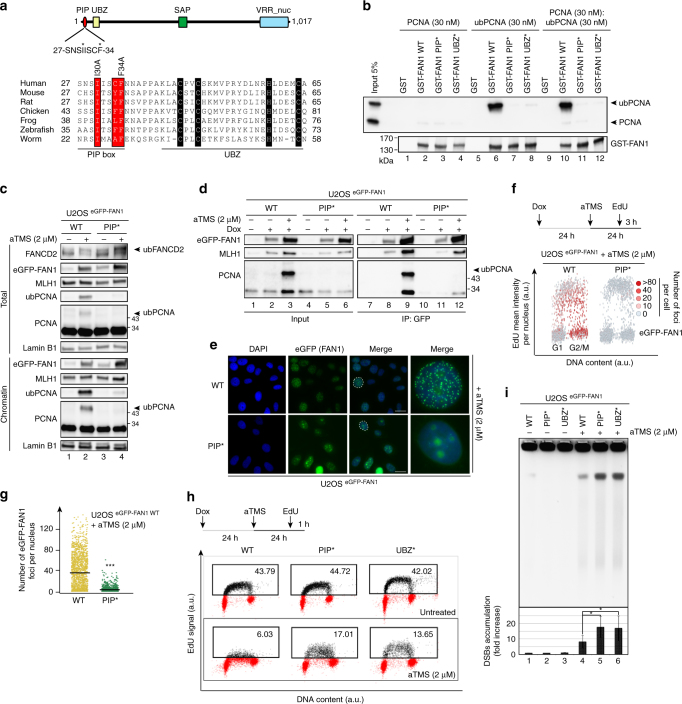
Fig. 4.
A non-canonical PIP-box motif and the UBZ domain of FAN1 are both required for binding to ub-PCNA. a Schematic representation of human FAN1 (top). Sequence alignment of the non-canonical PIP-box of FAN1 from different species. Residues important for ub-PCNA binding are highlighted in red. The CCHC residues of the UBZ domain zinc finger are highlighted in black. b GST, GST-FAN1 WT, GST-FAN1 PIP* and GST-FAN1 UBZ* variants were incubated with purified His-PCNA or His-ub-PCNA and retrieved with glutathione beads. PCNA and ub-PCNA in input and pull-downs were analysed by immunoblotting. A representative blot of three independent experiments is shown. c Total extracts and chromatin-enriched fractions of U2OS cells with the indicated genotypes treated with aTMS (2 μΜ; 24 h) were analysed by immunoblotting using the indicated antibodies. A representative blot of three independent experiments is shown. d Chromatin-enriched fractions derived from cells as in c, treated or mock-treated with aTMS (2 μΜ; 24 h), were incubated with anti-eGFP affinity resin. Inputs and immunoprecipitates were analysed by immunoblotting with the indicated antibodies. A representative blot of four independent experiments is shown. e Representative images of eGFP-FAN1 foci in cells as in c. Scale bar: 25 μm. f QIBC of eGFP-FAN1 foci was performed in cells as in c exposed to aTMS (2 μΜ; 24 h) and pulse-labeled with EdU during the last 3 h of aTMS treatment. The heat map indicates the mean eGFP-FAN1 intensity per nucleus. g Quantification of eGFP-FAN1 foci count derived from the QIBC analysis in f. Median levels are indicated by black bars. Statistical analysis was carried out using unpaired, two-tailed t-tests. P values expressed as ***(P < 0.001) were considered significant, n = 3. h U2OS cells with the indicated genotypes were left untreated or treated with aTMS (2 μΜ; 24 h), followed by incubation with EdU (1 h) and Click chemistry. EdU incorporation was evaluated by FACS. i DSBs formation was evaluated by PFGE in same cells as in h treated or mock-treated with aTMS (2 μM; 48 h). Quantification of three independent experiments is shown. Data are represented as mean ± s.d. (n = 3). Statistical analysis was carried out using unpaired, two-tailed t-tests. P values expressed as *(P < 0.05) were considered significant

