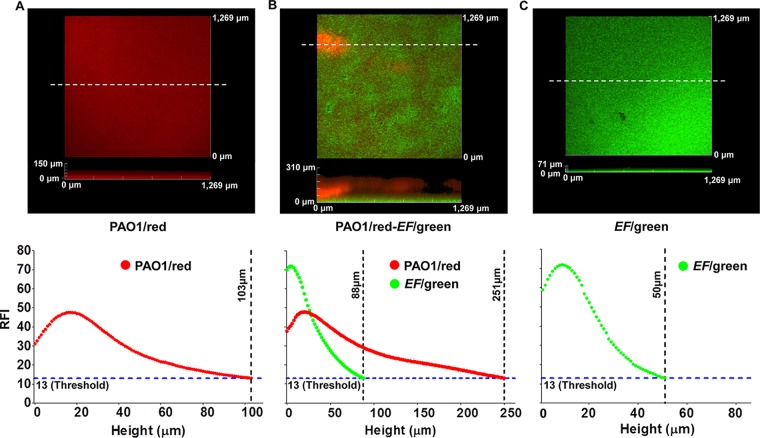
FIG 2.
CLSM image analysis of mono- and dual-species PAO1/red and EF/green biofilms. CLSM images and their relative fluorescent intensity measures along the heights of biofilms of PAO1/red (A), PAO1/red and EF/green (B), and EF/green (C). White dotted lines indicate the locations of sagittal sections for height representation of the biofilms. The relative fluorescence intensity (RFI) of 13 was considered the threshold for biofilm detection. The biofilms were incubated at 37°C for 48 h. The relative fluorescence intensities were measured using the ImageJ program.

