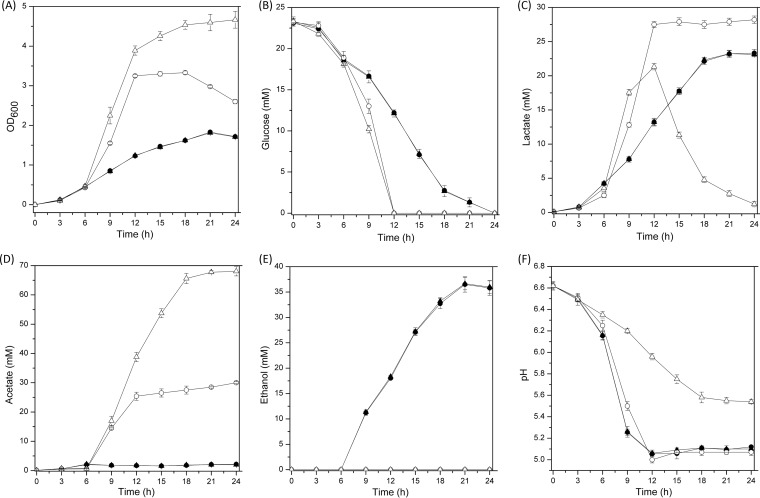
FIG 5.
Comparison of growth performance (A), glucose consumption (B), metabolite production (C to E), and pH (F) between the Δpdh mutant (circles) and the Δpox mutant (triangles) under anaerobic (closed symbols) and aerobic (open symbols) conditions. The curves for the two mutant strains under anaerobic conditions mostly overlap. In all panels, the values are means ± standard deviations of three independent experiments.

