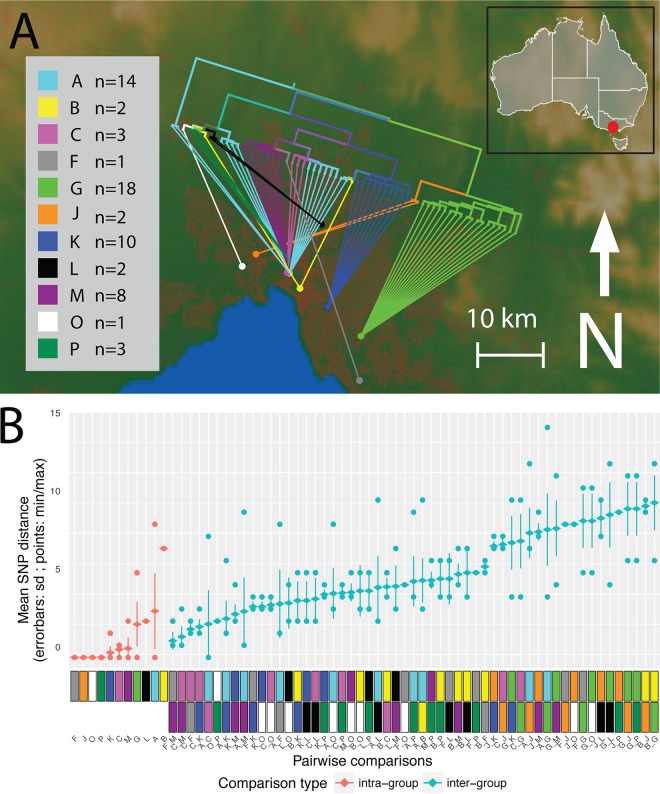
FIG 2.
Phylogeography of 64 Lpn-SG1 environmental isolate genomes. (A) Map of the greater Melbourne area, showing the location of the 11 cooling towers assessed during legionellosis outbreaks, designated by colored circles. “A” (light blue) represents the location Melbourne Aquarium outbreak and is close to the center of Melbourne. The inset shows the location of Melbourne (red circle) within the state of Victoria in Southeast Australia. Overall, the phylogeny aligns closely with the geography of originating cooling towers. For several outbreak codes, polyclonality is apparent, as some common origins have connecting lines drawn from different subclades of the phylogeny. Red coloration on the base map represents population density within the greater Melbourne region. The branch lengths of the tree have been transformed and are proportional to the number of nodes under each parent node. (B) Core genome pairwise SNP comparisons of within, and between, cooling tower isolate groups. Comparisons of specific epidemiologically defined groups (infection clusters) are indicated with color codes as defined in the key. All groups had smaller within-group diversity than between-group diversity.

