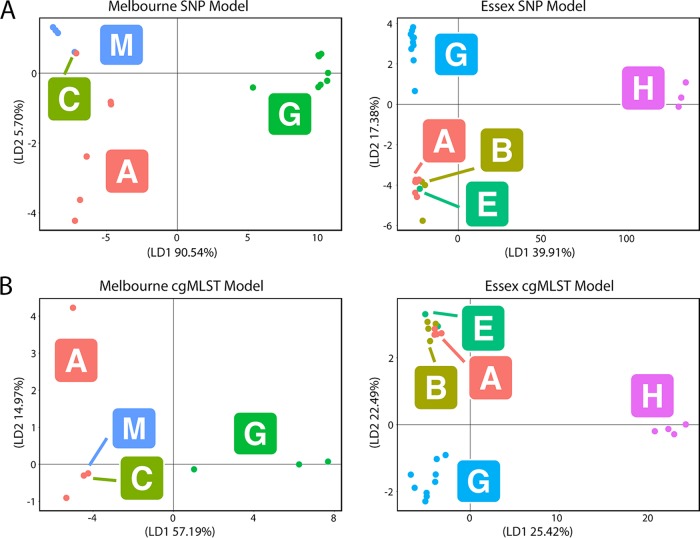
FIG 3.
Scatterplots resulting from DAPC. (A) Core genome SNP-based models of the Melbourne (top left) and Essex (top right) data sets. (B) Core genome MLST (cgMLST)-based models of the Melbourne (bottom left) and Essex (bottom right) data sets. The membership of each point within an epidemiologically defined cluster (e.g., “A” is the Melbourne Aquarium outbreak) is indicated by the colored circles and the corresponding letters labeled within squares. The amount of variation explained by the first and second discriminant (LD1 and LD2, respectively) functions are specified on the axes of each plot.

