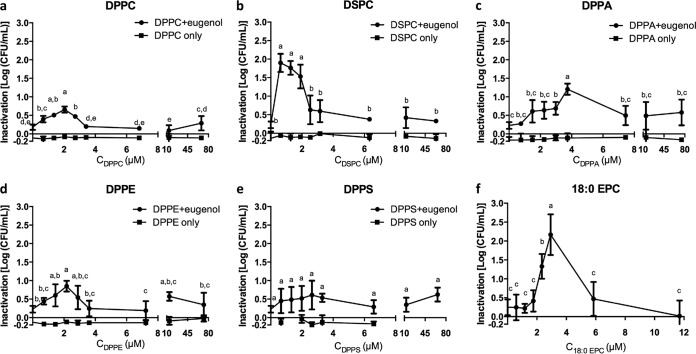
FIG 1.
Inactivation of E. coli C600 after 30 min of exposure to a constant eugenol concentration (0.043% [vol/vol]) and increasing levels of phospholipids (filled circles) and phospholipid-only controls (filled squares). All controls showed no inactivation effect. Means data followed by different letters are significantly different as determined using LSD analysis (α = <0.05). Error bars represent standard deviations of the means of results from three independent replicates.

