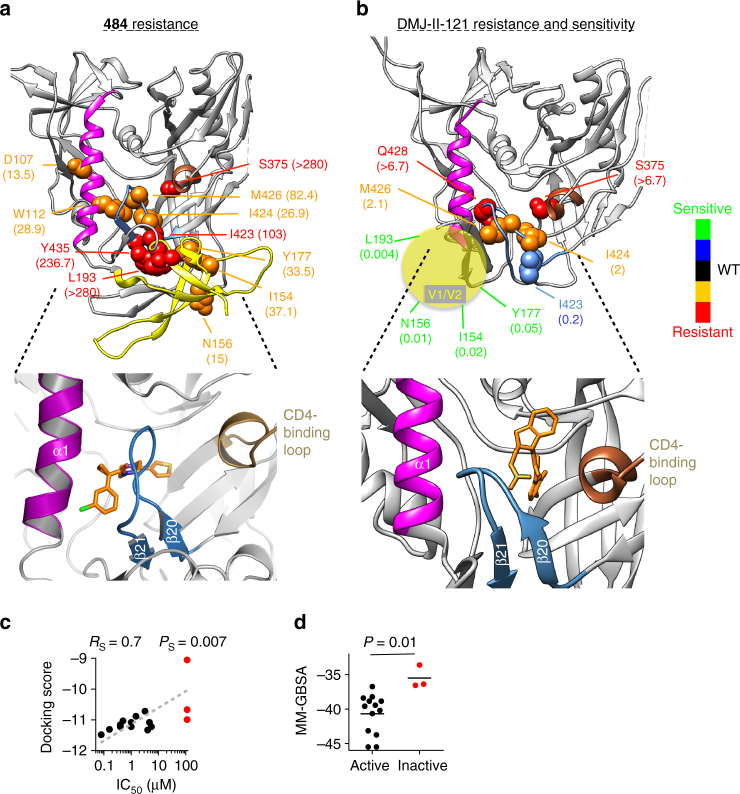
Fig. 2.
Genetic analysis and binding sites of chemical probes of HIV-1 Env conformation. a, b Amino acid residues associated with resistance or hypersensitivity to 484 and the CD4-mimetic compound DMJ-II-121 are shown on structures of the HIV-1BG505 soluble gp140 (sgp140) SOSIP.664 glycoprotein. We used an Env structure without sCD4 (Protein Data Bank (PDB) 4TVP)30 for mapping 484 susceptibility, and a CD4-bound Env conformation (PDB 5THR)22 for mapping DMJ-II-121 susceptibility. The CD4-bound Env model represents a fit of the sgp140 SOSIP.664 structure to an 8.9-Å-resolution cryo-EM density map; the model lacks the V1/V2 region, which is schematically represented (yellow sphere). In comparison with the structure of sgp140 SOSIP.664 without sCD4, the density map shows a large CD4-induced movement of the V1/V2 region of gp12022. The color code key indicates the level of resistance for the specified residues. The ratio of the mutant to wild-type HIV-1JR-FL IC50 values (fold change) for resistant and hypersensitive HIV-1 mutants is shown in parentheses; the IC50 value of each Env mutant is shown in Supplementary Table 4. Infectivity of the mutant HIV-1JR-FL viruses was not significantly affected by the amino acid changes except for two changes (I154A and N156A). The expanded image in the lower panel of a shows a docking pose of the 484 compound in the crystal structure of the HIV-1BG505 soluble gp140 SOSIP.664 component of the complex with BMS-62652928. The expanded image in the lower panel of b shows the crystal structure of DMJ-II-121 in complex with the HIV-1C1086 gp120 core (PDB ID 4I53).27 c, d The relationship between either the docking scores (c) or docking energy (d) and the antiviral activity of a panel of 484 derivatives was used to assess the reliability of the docking in a. The dashed line indicates the linear trend between the docking score and IC50 values. The scores and derivatives analyzed are shown in Supplementary Table 5. As a control, the BMS-626529 compound was docked into the crystal structure (Supplementary Fig. 4). Red color, non-active compounds (IC50 > 112 μM). Rs, Spearman coefficient; PS, Spearman P value; P, t test P value

