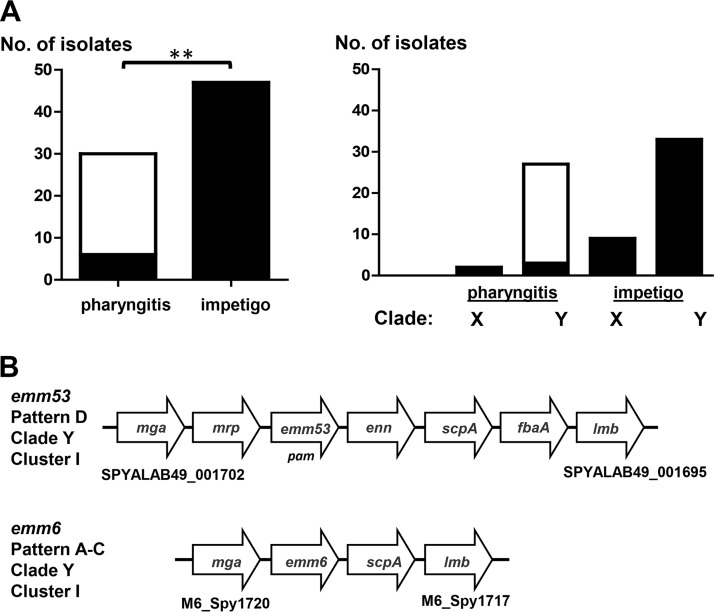
FIG 1.
Distribution of fbaA among cluster I pharyngitis and impetigo isolates. (A) fbaA-negative (open) and fbaA-positive (filled) isolates. **, P < 0.01 (Fisher's exact test, two-tailed). (B) Chromosomal maps of fbaA and flanking genes for representative impetigo (Alab49; emm53, emm pattern D, clade Y, cluster I, fbaA positive) and pharyngitis (MGAS10394; emm6, emm pattern A-C, clade Y, cluster I, fbaA negative) isolates. Genes and intergenic regions are not drawn to scale (13, 39).

