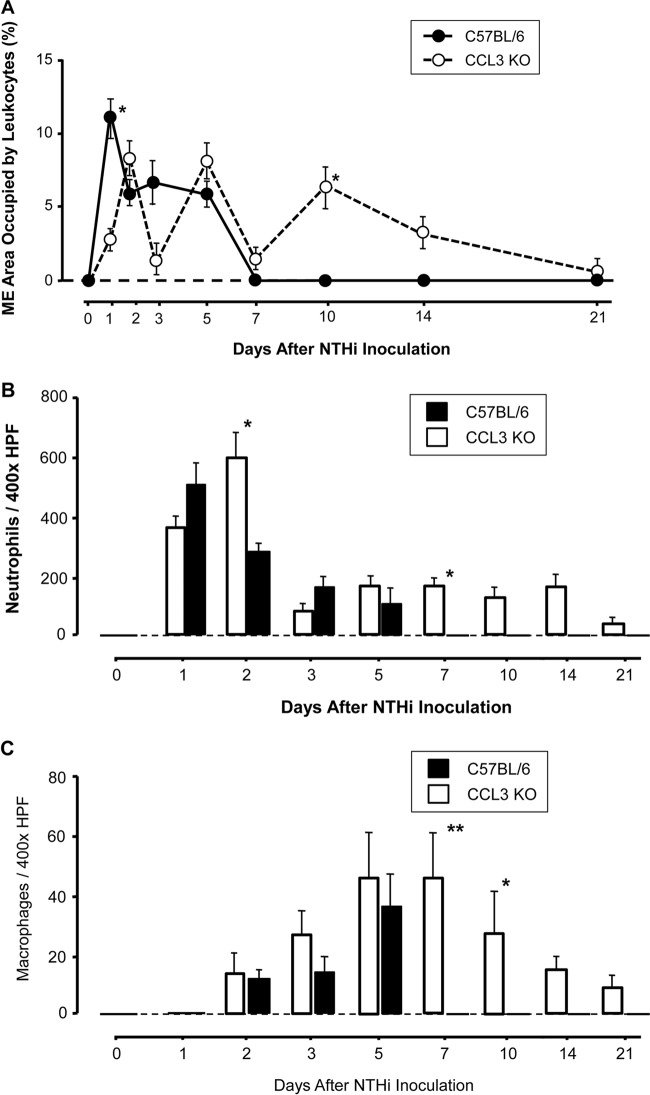
FIG 3.
Inflammatory cells in the ME cavity after NTHi infection. (A) Percent area of the ME cavity occupied by leukocytes during OM in WT and ccl3−/− mice. The initial level of leukocyte infiltration on day 1 post-NTHi inoculation was significantly lower in CCL3−/− MEs (*, P < 0.05 by a Mann-Whitney U test), as was also observed on day 3. While the infiltration of both WT and ccl3−/− MEs declined on day 7, ccl3−/− MEs showed a significant increase on day 10. Thereafter, leukocytes were observed only in ccl3−/− MEs although not in every case. (B) Number of neutrophils in a standard area (×400 field) of ME infiltrates. Neutrophils were the primary cell type in ME infiltrates throughout the observation period. In the absence of CCL3, neutrophil infiltration peaked after 2 days following a slight delay. Numbers of neutrophils were significantly increased in the MEs of ccl3−/− animals on days 2, 7, 10, and 14 (*, P < 0.05; **, P < 0.01 by a Mann-Whitney U test) compared to those in WT animals and persisted in at least some MEs through day 21. HPF, high-power field. (C) Number of macrophages in a standard area of ME infiltrates. Macrophages were recruited to the ME by 2 days after NTHi infection of both WT and ccl3−/− animals. ccl3−/− mice displayed a prolonged presence of macrophages in MEs, with significantly increased numbers of macrophages on days 7 and 10 (*, P < 0.05 by a Mann-Whitney U test), and macrophages were still present in some ears on day 21 (n = 6 to 8 MEs per time point and strain; bars and error bars represent means ± SEM). It should be noted that since the measurements in panels B and C were taken from the largest cellular clusters in a given ear, the numbers do not reflect the total number of leukocytes in each ear. Rather, they reflect the density of the cell clusters and the proportions of neutrophils and macrophages present.

