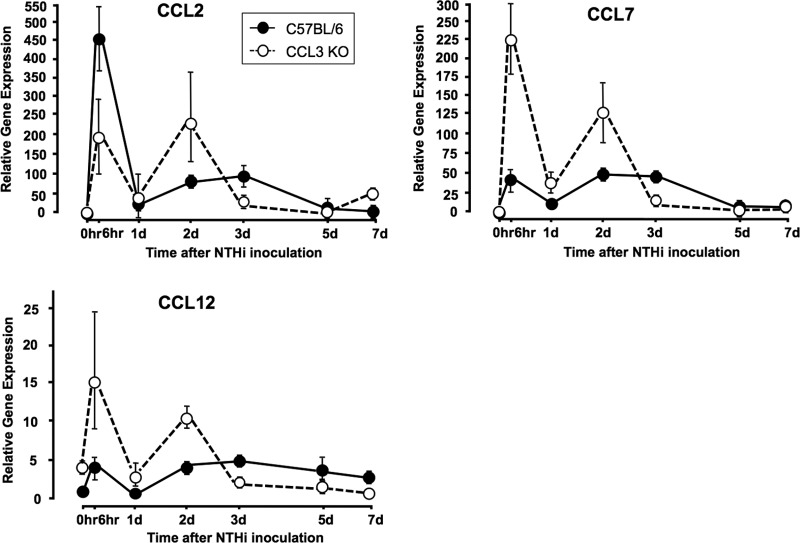
FIG 5.
Expression levels of CCL2, CCL7, and CCL12 mRNAs in the MEs of WT versus CCL3-null mice during OM. cDNAs were generated from 6 MEs at each time point. The 0-h time point denotes untreated mice. Results represent data from 2 replicates, with error bars denoting the 95% confidence intervals. Data points for which the confidence intervals do not overlap are significantly different between the two genotypes.

