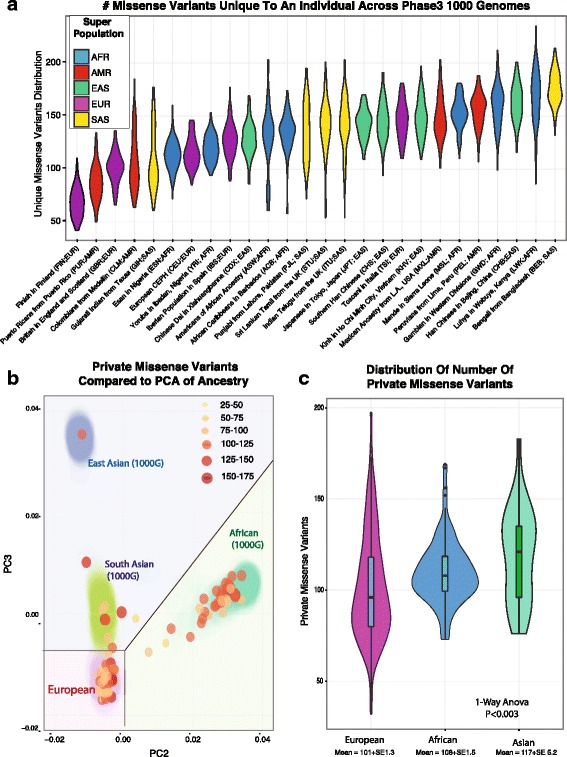
Fig. 1.

Correlation between ancestry and the effectiveness of using database filters to identify somatic variants. a The distribution and number of variants unique to an individual across 2503 individual from Phase 3 of 1000 Genomes plotted as violin plot for each of 26 different populations (indicated by their 3 letter code), and colored based on their ancestral super population. b The number of private variants for 150 individuals after filtering through 1000 Genomes, ExAc. not previously sequenced shown by their principle components of common variation (>1%) is shown as a color-metric bubble chart. c The distribution of variants within the groups within the right PCA plot, correlating to sections in B, where individuals clustering near those of European, Asian, and African Ancestry
