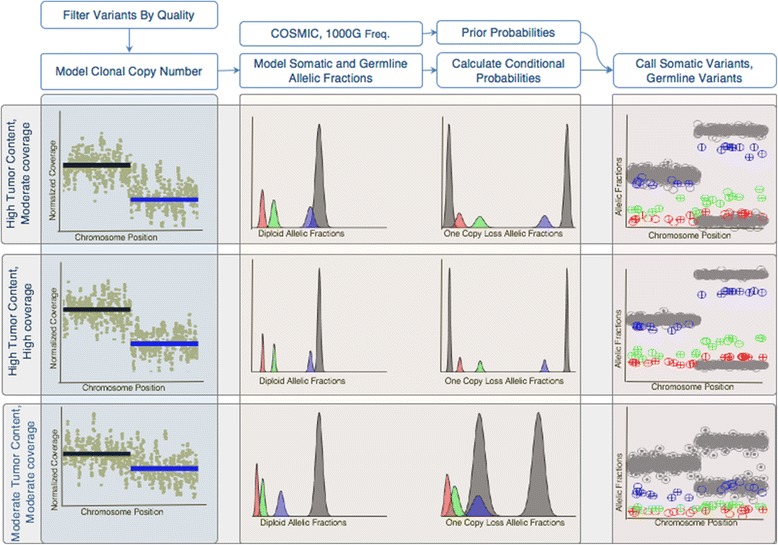
Fig. 2.

Overview of Variant Calling Strategy. After filtering candidate variant positions by quality, an EM approach is used to fit a model of clonal allelic copy number. The plots on the left show example copy number plots for three conditions, the top panel showing high tumor content and moderate coverage, the middle panels with high tumor content and high coverage, and the bottoms panel with moderate tumor content and moderate coverage. A one copy loss is detected in the segment indicated by the blue line in the first left-most column. Next the expected somatic and germline allelic fractions are modeled in subsequent column. The center two columns plots the expected allelic fractions for germline variants (grey), somatic main clone (blue), and somatic sub clonal (green and red) for diploid regions (left) and one copy loss regions (right). We can see that in high tumor content, moderate coverage, the main clone distribution overlaps with the germline and is difficult to detect in the diploid region, while the red sub-clone is more difficult to detect in the one copy loss region. Increasing the coverage increases sharpness of the distributions making the somatic variants easier to detect. In the moderate tumor content sample, all clones are easy to differentiate from germline in the diploid region, but the main clone is hard to detect in the one copy loss region. Using these distributions to calculate conditional probabilities, as well as using 1000 genomes population frequencies and COSMIC mutation counts to calculate prior probabilities, somatic and germline variants can be called. The right most columns show plots of the allelic fractions of germline (grey) and somatic variants colored by clone. In these, encircled ‘+’ indicates the variant was detected and empty “o” indicates a false negative. As expected, in the high tumor content moderate coverage condition, variants in the main clone are detected better in the deleted region, and the number of variants detected increases in the high coverage condition
