Fig. 6.

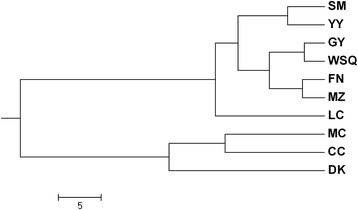
Dendrogram obtained using UPGMA cluster analysis based on Nei’s genetic distances among the ten populations of almonds. The population abbreviations are the same as those in Additional file 7

Dendrogram obtained using UPGMA cluster analysis based on Nei’s genetic distances among the ten populations of almonds. The population abbreviations are the same as those in Additional file 7