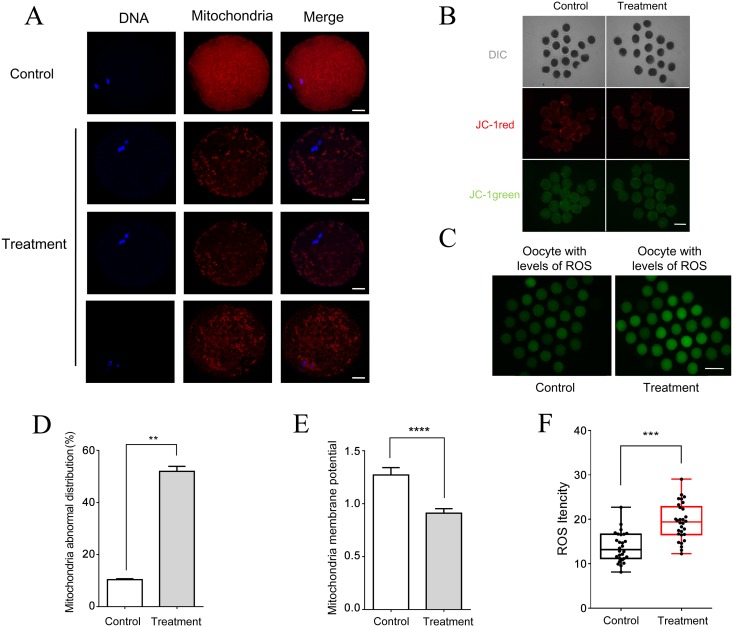
Fig. 7.
RAD51 inhibition led to abnormal mitochondrial distribution and increased intracellular ROS levels. (A) Mitochondrial distribution in RAD51 inhibitor-treated and untreated control oocytes as detected by immunostaining. Porcine oocytes were cultured in the presence of B02 (50 μM) for 44 h (MII stage). Red, mitochondria; blue, DNA. Scale bar = 20 μm. (B) Red fluorescence corresponds to activated mitochondria and green fluorescence corresponds to less-activated mitochondria. Scale bar = 120 μm. (C) ROS staining in B02-treated (50 μM) and untreated (control) MII oocytes. Scale bar = 240 μm. (D) Percentage of B02-treated (50 μM) and untreated (control) oocytes with abnormal mitochondrial distribution. ** P < 0.01. (E) Membrane potential was measured as the ratio of red fluorescence to total fluorescence. **** P < 0.0001. (F) ROS levels in B02-treated and control oocytes were measured as green fluorescence intensity. *** P < 0.001. The data were obtained from three independent experiments.

