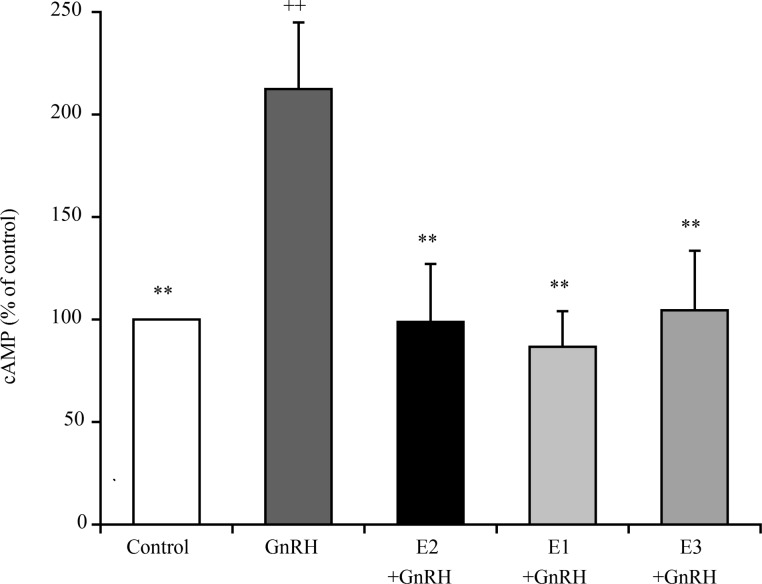
Fig. 4.
Comparison of the effects of 0.01 nM of E2, E1, and E3 on the levels of cyclic AMP (cAMP) in cultured bovine AP cells treated with 1 nM GnRH. The concentrations of cAMP in the control cells (cultured in medium alone; shown as white bars) were averaged and set at 100%, and the mean cAMP concentration for each treatment group is expressed as a percentage of the control value. ++ P < 0.01 compared to the control; ** P < 0.01 compared to GnRH alone.

