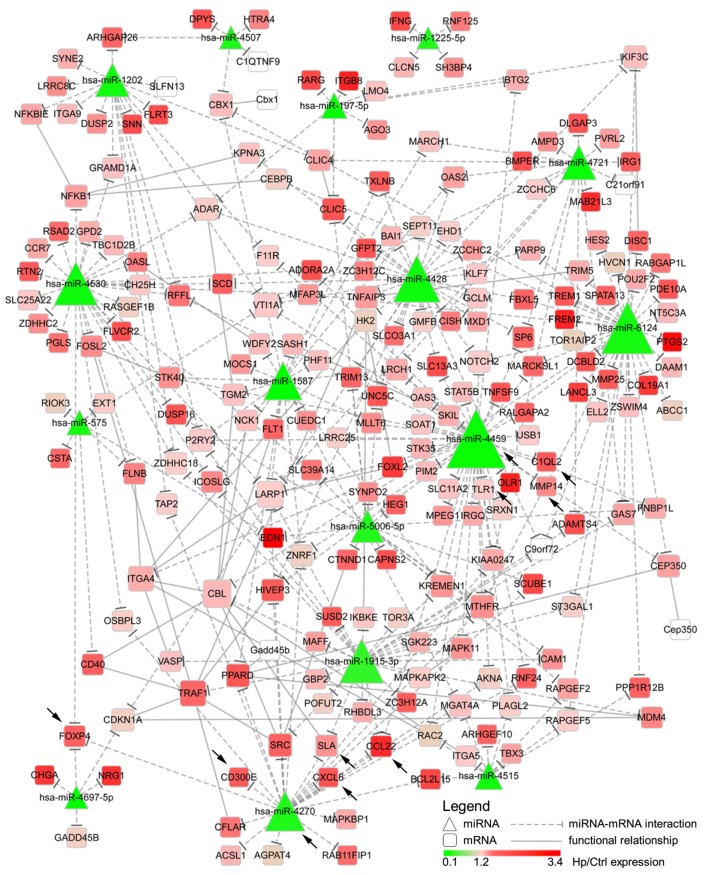
Figure 3.
Integration of microRNAs (miRNAs) and mRNA targets. The network describes the interactions between miRNAs downregulated both after 24 and 72 h of Helicobacter pylori (Hp) infection and the predicted targets. The higher the node size is, the higher the number of edges connected with it is. Color scale mirrors the expression of miRNAs and genes in Hp-infected vs non-infected macrophages (Ctrl). Triangles represent miRNAs, whereas round squares refer to mRNAs. Dashes edges interconnect miRNAs with their targets, whereas filled edges describe functional relationships between different mRNAs. Arrows indicate genes, and miRNAs for whom the expression was confirmed in human derived macrophages by qRT-PCR.

