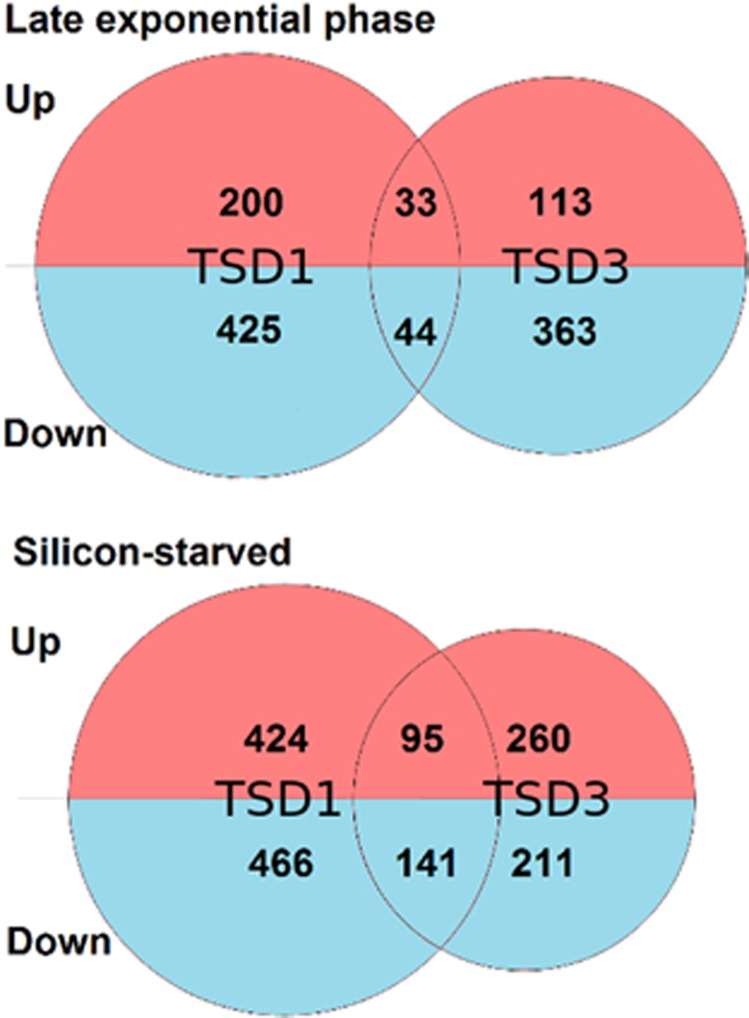
Figure 3.
Representation of the numbers of genes found to be significantly differentially regulated in TSD1 and TSD3 cell lines compared with NAT control cells in late exponential (top) and silicon-starved (bottom) conditions. Venn diagrams are to scale with total numbers of differentially regulated genes identified in TSD1 and TSD3 with overlaps corresponding to the number of genes found to be differentially regulated in both TSD cell lines compared with NAT. The numbers of up- and downregulated genes identified are given in the red and blue sections of the diagrams, respectively.

