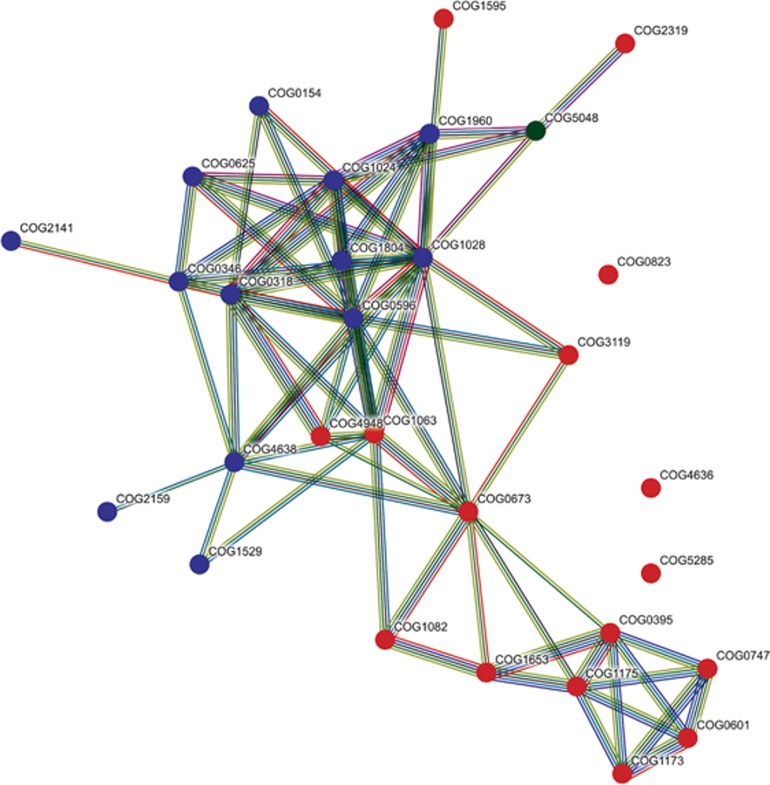
Figure 5.
STRING network of the 30 COGs contributing most to the grouping of the sponge-symbionts in Figure 4. Circles representing the COGs’ position in the network are colored according to the symbiont group where they are overrepresented (group I–III: blue, red and green, respectively). Colors of the connectors indicate the type of evicence of the predicted interactions between the two connected COGs as shown in Figure 2. Only connections of ‘high confidence’ (minimum required interaction score: 0.700) are shown.

