Figure 2.
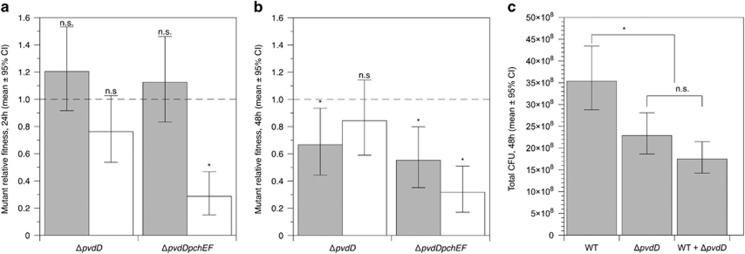
(a, b) Relative fitness of ΔpvdD and ΔpvdDΔpchEF mutants in pure culture (grey bars) and in mixed culture with an isogenic wild type (white bars) in ASM after (a) 24 and (b) 48 h of growth. After eliminating variation due to experimental block, we found significant effects on 24-h fitness of mutant genotype (ANOVA: F1,33=6.96, P=0.012), presence/absence of the wild type (F1,33=26.8, P<0.001) and their interaction (F1,33=4.49, P<0.042). Neither mutant had a relative fitness significantly different from 1 when grown in pure culture (post hoc t-tests, P⩾0.17). ΔpvdD mutant fitness was unaffected by the wild type (relative fitness in mixed culture not significantly different from 1; post hoc t-test, P=0.074), but the ΔpvdDΔpchEF mutant was outcompeted in mixed culture (post hoc t-test, P<0.001). The only significant determinant of 48-h fitnes was genotype (ANOVA eliminating experimental block: genotype F1,35=8.34, P=0.007; presence/absence of the wild type: F1,33=0.277, P=0.602; interaction term: F1,33=3.62, P=0.065). Post hoc t-tests showed that the ΔpvdD mutant was less fit than the wild type when grown in pure culture (P=0.018) but as fit as the wild type in mixed culture (P=0.279). The ΔpvdDΔpchEF mutant had a relative fitness <1 in both pure and mixed culture (P⩽0.001). (c) Cheating by ΔpvdD over 48 h of co-culture results in mixed wild-type+mutant cultures showing the same reduction in total population density as pure mutant cultures (ANOVA eliminating experimental block, F2,26=12.6, P<0.001; Dunnett’s test for mutant/mixed populations versus wild type: P=0.009 and <0.001, respectively; post hoc t-test for mutant versus mixed populations, P=0.159). In all panels, bars show means of 9–10 replicates split across two replica experiments, with associated 95% confidence interval. In both panels, results of post hoc tests for relative fitness=1 are shown with *=P<0.02; n.s.=not significant.

