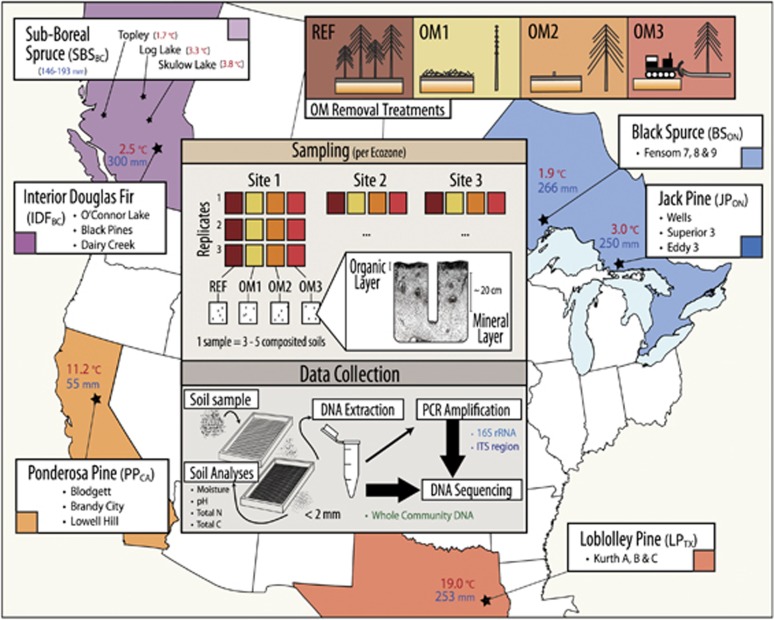
Figure 1.
Overview of experimental design superimposed on a map of sampling locations in each of the six ecozones (three replicate sites per ecozone). Ecozones were named after the predominant tree species in the region. Mean annual temperature and precipitation during the warmest quarter are provided. Samples from SBSBC and IDFBC were originally collected by Hartmann et al. (2012). The methods of sample processing and sequencing were identical. Where available, photographs of treatment plots at the time of harvesting and at time of sampling can be found in the Supplementary Materials III.

