Figure 2.
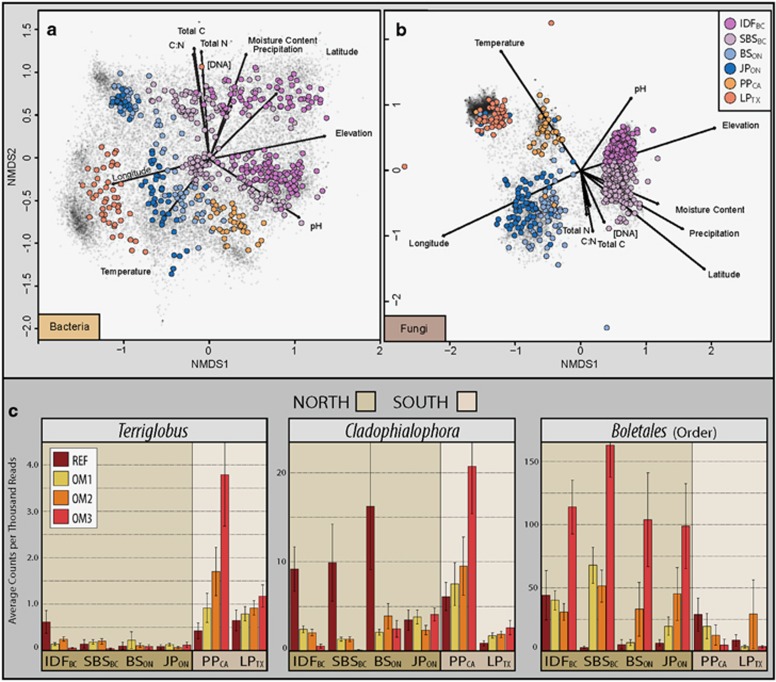
Geographic differences in community structure illustrated by non-parametric multidimensional scaling of bacterial (a) and fungal (b) pyrotag libraries and by trends in relative abundance of specific taxa whose response to harvested treatments differed between northern and southern sites (c). NMS was based on Bray-Curtis dissimilarities and individual OTUs were mapped as black crosses (~44 000 bacterial and 16 000 fungal OTUs) and samples were mapped as colored circles. Unlike ITS libraries, bacterial 16 S rRNA gene libraries exhibited a clear split between organic (top) and mineral (bottom) layers, though samples from the organic layer in PPCA and LPTX were not mapped due to incomplete environmental data. Experimental factors were fitted to ordination with arrow length proportional to the correlation between variable and ordination axes.

