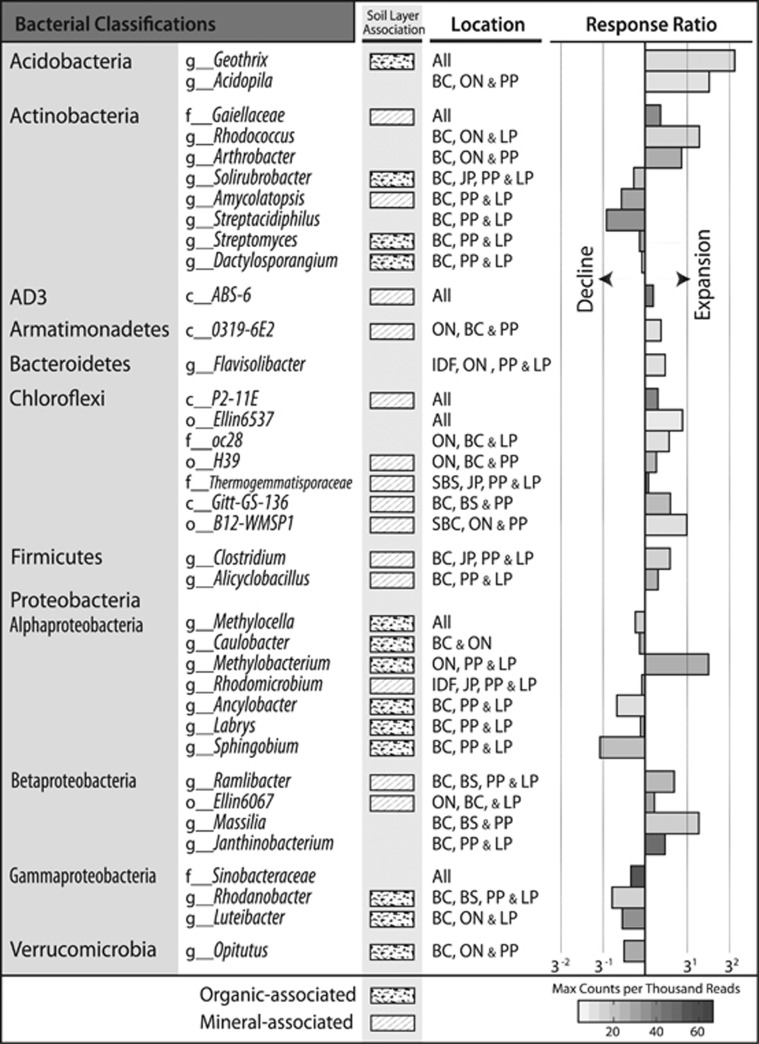
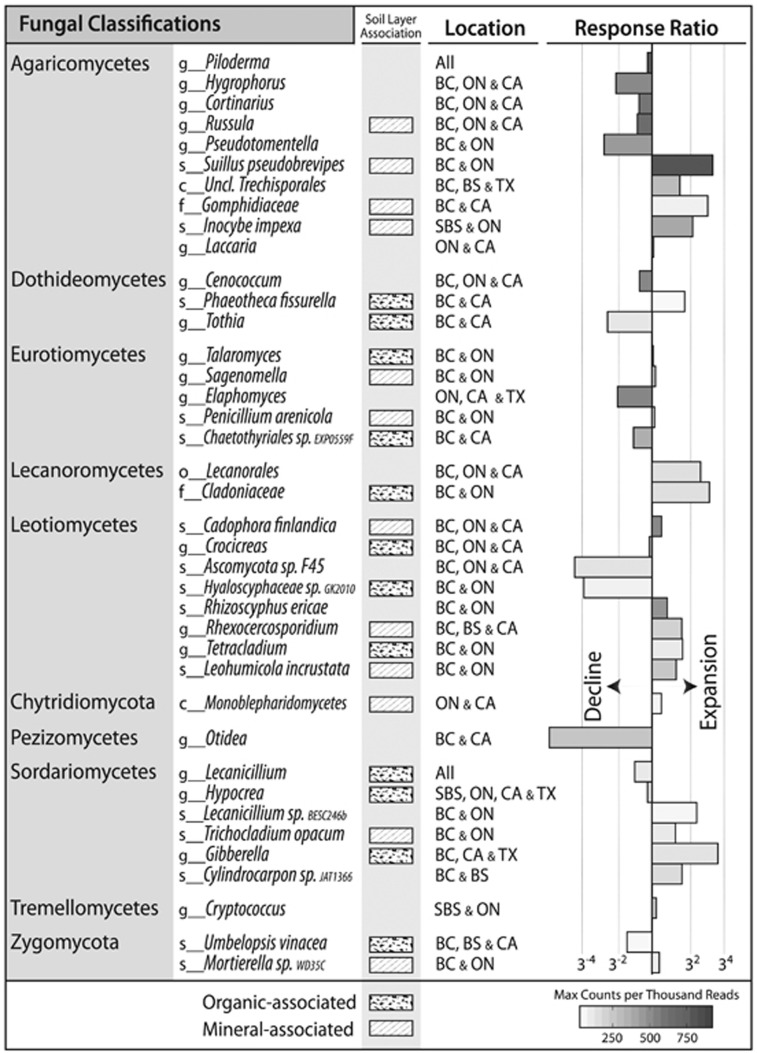
Figure 7.
A table of bacterial and fungal taxa that expanded or declined in response to harvesting in four or more ecozones. The lowest depth of classification supported by bootstrapping (>80) is provided and is prefaced by rank (c, class; o, order; f, family; g, genus; s, species). Mineral layer and organic layer-associations are noted by shaded squares. Response ratio barplots show the average abundance in all three harvested treatments divided by the average abundance in REF. Bars are shaded according to the maximum observed relative abundance of each taxon indicated in scale bar. Changes observed in both Ontario ecozones (BSON and JPON) were denoted by ‘ON’ and, similarly, effects observed in both British Columbian ecozones (IDFBC and SBSBC) were denoted by ‘BC’.


