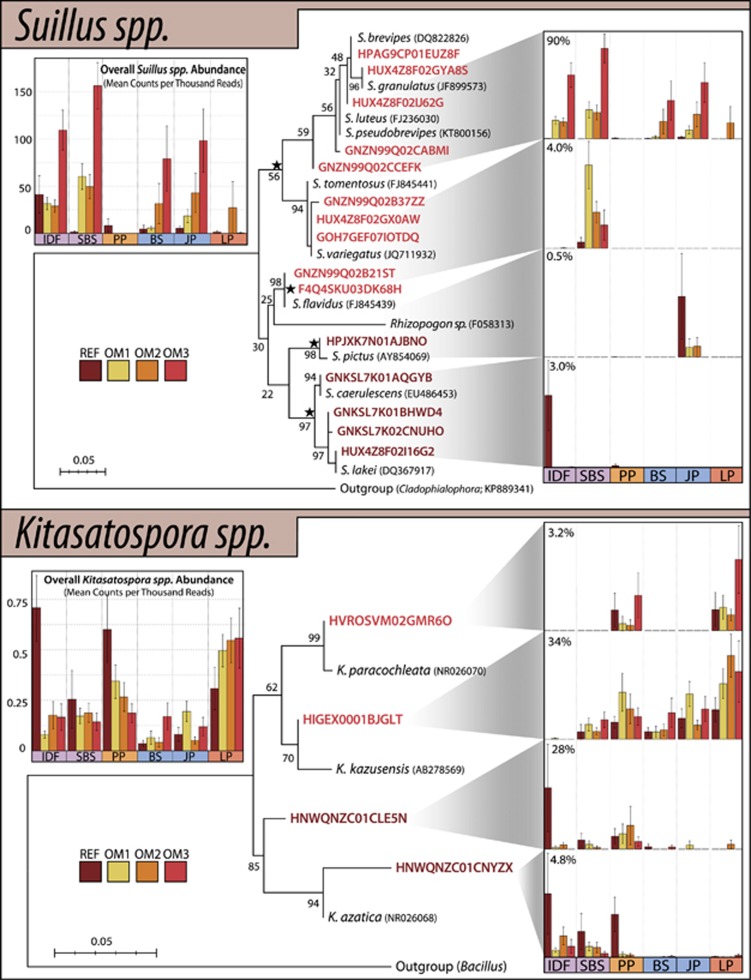
Figure 8.
Maximum-likelihood phylogenetic trees for predominant OTUs from the fungal genus, Suillus, and bacterial genus, Kitasatospora, accompanied by their abundances in harvested treatments. OTUs names are colored according to whether they exhibited expanding (red) or declining (brown) relative abundances in harvested treatments. Barplots on the left show the sum of counts for each genus, while barplots on the right show the abundances of individual clades (marked with stars). For simplification, the Y-axis on the right-side plots corresponds to percent abundance of each clade in its respective genus. Overall, Suillus spp. accounted for an average of 5% of ITS reads per library, while Kitasatospora spp. accounted for an average of 0.05% of 16 S reads per library. Aligned sequences were trimmed to 355 bp (Suillus) and 250 bp (Kitasatospora) before tree building.

