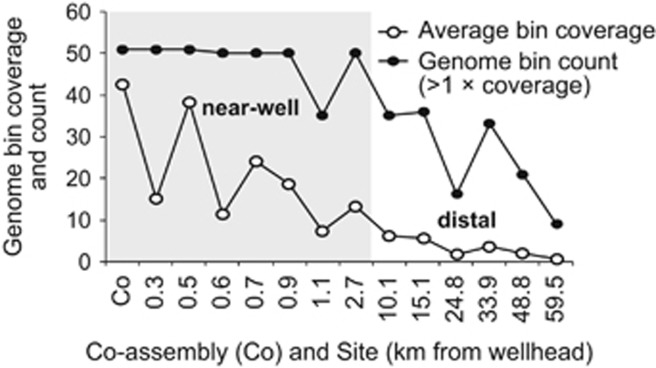
Figure 1.
Average genome bin coverage and count (for bins with >1 × coverage) in the co-assembly, and for the same collection of genome bins at each individual site; both decrease noticeably with increasing distance from the wellhead, although some of the genomes were still detectable 60 km away. Distance along the x axis is not shown to scale.

